 GECKO
GECKO
The Question
The overnight vs intraday split found that the five UK banks in Gecko’s universe — BARC, HSBA, LLOY, NWG, STAN — do most of their moving during the trading session, while several other stocks (mostly miners) do most of theirs overnight, before ORB can ever touch it. That’s a structural reason to expect ORB to perform differently on banks than on the broad universe.
Two questions follow from that. First: does it actually hold up — does every ORB variant tested so far do better on banks specifically, or was that just true of the one trend-filter config that motivated this? Second, and more important: if banks really do look better, is that a genuine edge, or is it just what a smaller, five-stock sample looks like when nothing about the underlying signal has actually changed?
The Data: Every Config, Two Scopes
All 12 ORB variants published on this site so far were rerun against just the five banks, same date range (2019-01-01 to 2026-08-11) as every other test on this site. Average R and profit factor — the two scope-independent metrics — are compared below against the original 28-stock figures. Each config name links to the original post explaining exactly what that variant changed and why.
| Config | 28-stock Avg R | Banks Avg R | 28-stock PF | Banks PF |
|---|---|---|---|---|
| Baseline (#88 → #107) | 0.0153 | 0.0406 | 1.04 | 1.11 |
| Buy-stop 0.2% (#95 → #108) | 0.0212 | 0.0272 | 1.07 | 1.10 |
| Buy-stop 0.5% (#96 → #109) | 0.0130 | 0.0122 | 1.06 | 1.06 |
| Buy-stop 1% (#97 → #110) | 0.0060 | 0.0063 | 1.03 | 1.04 |
| 15-min range (#98 → #111) | 0.0165 | 0.0550 | 1.04 | 1.13 |
| Noon cutoff (#99 → #112) | 0.0142 | 0.0370 | 1.04 | 1.10 |
| Exclude LARGE (#100 → #113) | 0.0156 | 0.0337 | 1.04 | 1.08 |
| Exclude MED+LARGE (#101 → #114) | 0.0221 | 0.0062 | 1.04 | 1.01 |
| Trend AND 1% (#103 → #115) | 0.0178 | 0.0490 | 1.05 | 1.13 |
| Trend OR 1% (#104 → #116) | 0.0213 | 0.0642 | 1.05 | 1.18 |
| Trend OR 2% (#105 → #117) | 0.0195 | 0.0528 | 1.05 | 1.14 |
| Trend OR 0.5% (#106 → #118) | 0.0218 | 0.0697 | 1.06 | 1.19 |
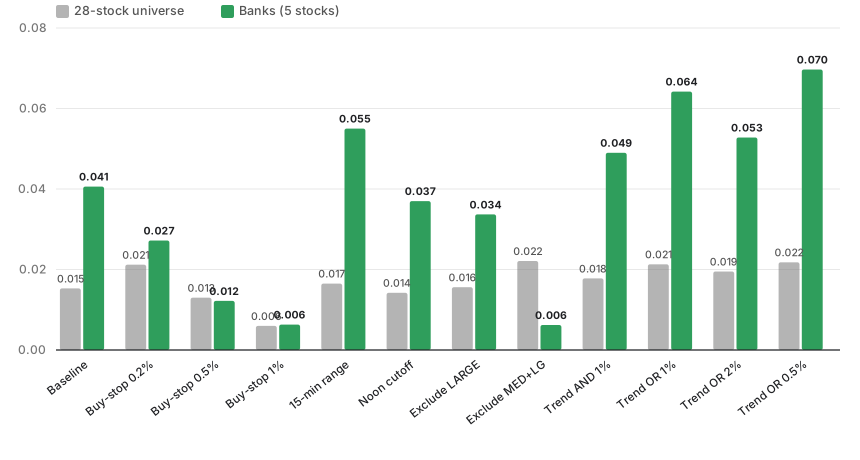
Banks (green) beats the 28-stock universe (grey) in 11 of the 12 configurations tested — the one exception, Exclude MED+LARGE, is the config that collapses to just 350 trades on banks and is called out below.
Every config improved on banks except one — the smallest-opening-range filter (#101 → #114), which on the full universe already restricted trading to just 2,234 setups; narrowed to five stocks it collapses to only 350 trade plans, too thin a sample to draw a conclusion from in either direction. Everywhere else the improvement is consistent and often large: the best configuration on the broad universe (#106, trend filter with a 0.5% threshold) goes from 0.0218 to 0.0697 average R on banks, and its profit factor from 1.06 to 1.19 — the only two configurations that turn net-positive at all (#116 and #118) are both banks-only runs.
Net £ figures aren’t included in the table above deliberately — banks-only runs take roughly a tenth as many trades as the full universe, and net result is sensitive to trade count in a way average R and profit factor aren’t. The full backtest summary table has every figure for both scopes if you want to check that reasoning yourself.
The Statistical Check: Is Banks Real, or Just a Smaller Lucky Sample?
A consistent improvement across 11 of 12 configurations is suggestive, but it doesn’t rule out the simplest explanation: banks is a five-stock sample, and smaller samples are noisier — sometimes noisier in a flattering direction. The way to check that is a permutation test: take the real trades, shuffle which ones are LONG vs SHORT a thousand times, and see how the real result ranks against a thousand random ones.
This was run on the strongest configuration (#106/#118, the 0.5% trend filter) against both scopes, 1,000 shuffles each:
| Banks (5 stocks) | Broad universe (28 stocks) | |
|---|---|---|
| Real average R (bidirectional) | 0.0289 | 0.0071 |
| Null distribution mean | 0.0046 | 0.0016 |
| Null distribution stddev | 0.0131 | 0.0056 |
| Real result beats | 968 / 1,000 shuffles | 837 / 1,000 shuffles |
| Percentile | 96.8th | 83.7th |
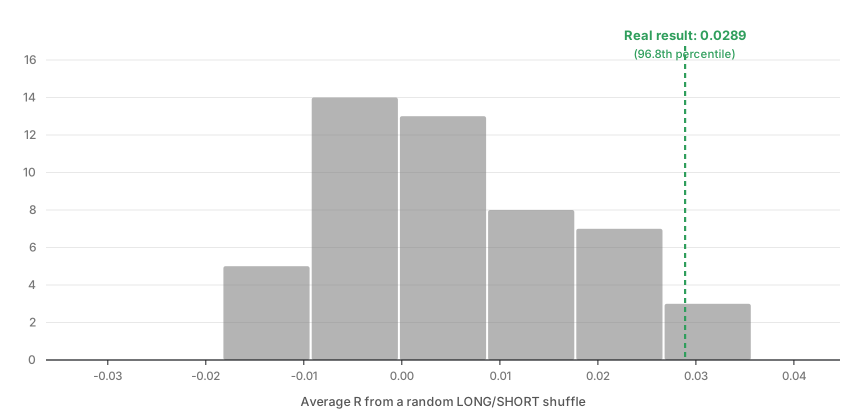
The histogram shows a sample of the null distribution — what pure chance produces when the LONG/SHORT call is randomised on the same trades. The real, unshuffled result sits well out in the right tail, clear of where random shuffles cluster.
Banks clears the conventional significance bar (roughly the 95th percentile, or a one-tailed p-value around 0.05) — only 3.2% of random direction-shuffles did as well or better than the strategy’s actual directional call. The broad 28-stock universe doesn’t clear it: 16.3% of random shuffles matched or beat it, which is too common to call a real signal with any confidence.
Two things worth being precise about here. First, the “real average R” figures in this table (0.0289 and 0.0071) are bidirectional — the permutation test needs real LONG/SHORT variation to shuffle, so unlike every other figure on this site it isn’t restricted to LONG-only trades, and isn’t directly comparable to the 0.0697 and 0.0218 figures in the table above. Only the percentile carries across scopes. Second, this is one pre-specified subset, chosen because the overnight/intraday split gave an independent, structural reason to expect it to behave differently — not one of several subsets tried until something looked good. That’s a meaningfully weaker form of evidence than a result from a single pre-registered test would be if this were the only thing ever tested, but it’s a real step up from noticing a good number after the fact and calling it a finding.
What This Means
Two conclusions, held with different confidence:
Across the full 28-stock universe, ORB’s directional call is not statistically distinguishable from a coin flip. An 83.7th percentile result — beaten by 1 in 6 random shuffles — is not strong enough evidence of a genuine LONG/SHORT edge, regardless of how the average R or profit factor numbers look in isolation.
On the five UK banks specifically, there’s a real signal. The banks configuration beats 96.8% of random shuffles, every metric improves in 11 of 12 configurations tested, and there’s an independent structural reason — the overnight/intraday split — for expecting exactly this instrument subset to behave differently. That combination is meaningfully more convincing than either the permutation result or the overnight/intraday pattern would be alone.
Neither conclusion means “ORB works” or “ORB doesn’t work” in some general sense — verdicts on this site are always relative to what was tested against. What this does mean: continuing to test ORB pooled across all 28 stocks is likely diluting a real signal that exists on a subset of the universe, and which instruments get tested turns out to matter at least as much as how the strategy itself gets tuned.
What This Led To
The banks subset earns a permanent place in how future ORB variants get evaluated — not as a replacement for the 28-stock universe, but as a second, structurally-motivated lens alongside it. The obvious next steps: run the permutation test against more of the 12 configurations rather than just the strongest one, and look for other instrument groupings the overnight/intraday data suggests are worth pre-specifying, rather than mining the existing 28 stocks for whichever subset happens to look best.