 GECKO
GECKOThe Hypothesis
The ORB baseline enters trades on a market order. This test instead enters on a STOP order with a small price buffer past the breakout candle’s high or low, requiring the market to confirm the move before getting in.
The question is: Does using a STOP order with a small price buffer increase the trading edge?
Background
Many traders like the market to confirm their theory before entry and opt for a STOP order instead of a market order.
- For a long trade a BUY STOP means you enter the trade at the same, or greater, than the given price
- For a short trade a SELL STOP means enter the trade at the same, or less, than the given price
Then the trader will sit back and wait for the market to either prove that there is a movement in the breakout direction, or not.
The theory is that by putting in a STOP order you should filter out weaker breakouts that do not end up travelling in the predicted direction. The potential downside is that you get in on the trade a bit later and miss some of the price movement, and therefore profit.
I performed three backtests here with a stop at 0.2%, 0.5% and 1.0% percent beyond the breakout price. For example, if the breakout was at £1.00 then the STOP order would be put in for £1.02, £1.05 or £1.10.
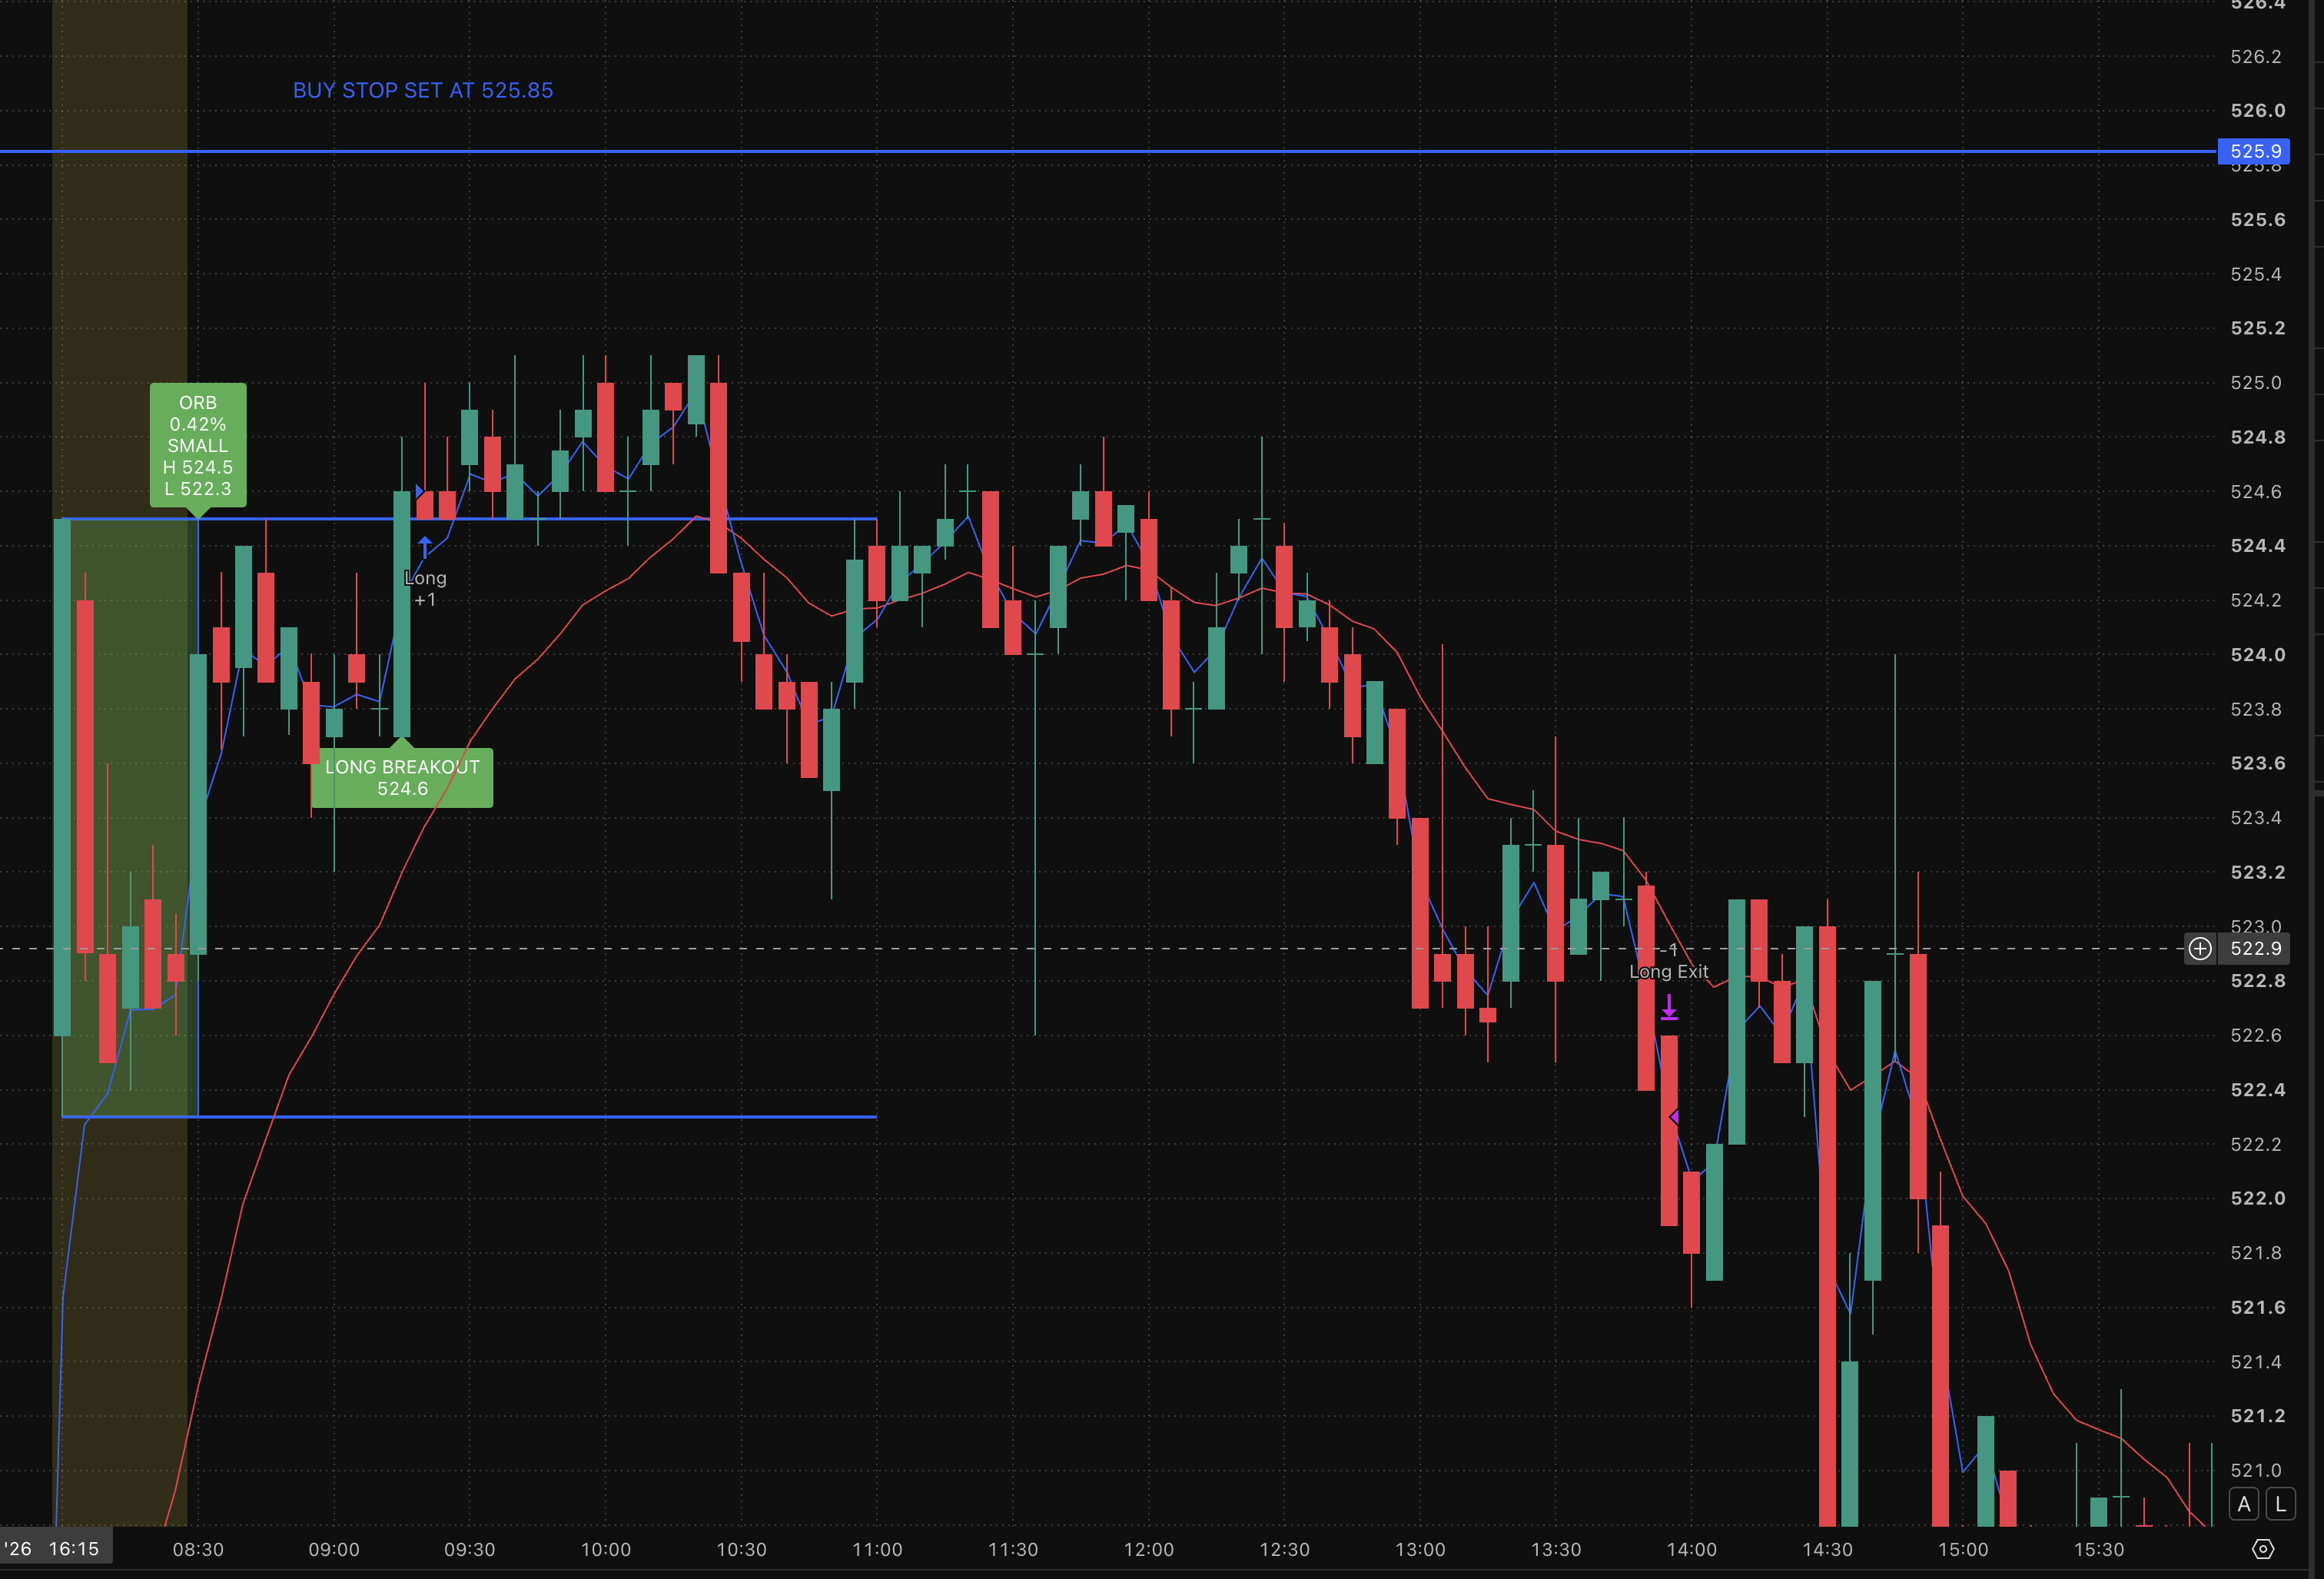
The breakout candle at 09:15 (labelled “LONG BREAKOUT”), has its wick high at 524.8. The buffer is applied to that high, so the STOP = 524.8 × 1.002 = 525.8496 (see the blue line). In this scenario the price never reaches the STOP price so the trade is not entered. In the baseline scenario the trade would have been entered as a market order at 09:20
Settings
Exactly the same as the ORB baseline except with a BUY STOP and a price buffer of 0.2%, 0.5% and 1.0%.
Scope
All tests were run against the LSE stocks and dates detailed here.
Backtest #95, #96, #97 Results
The results below show the baseline results side-by-side with the three tests here.
| Category | Metric | Baseline (#88) | 0.2% Buffer (#95) | 0.5% Buffer (#96) | 1% Buffer (#97) |
|---|---|---|---|---|---|
| Trade Activity | Trade plans | 21,869 | 21,869 | 21,869 | 21,869 |
| Trades entered | 21,869 (100.00%) | 17,430 (79.70%) | 12,644 (57.82%) | 6,828 (31.22%) | |
| Not triggered | 0 | 4,439 | 9,225 | 15,041 | |
| Execution Outcomes | Take profit | 1,813 (8.29%) | 559 (3.21%) | 160 (1.27%) | 38 (0.56%) |
| Stop loss | 6,899 (31.55%) | 3,161 (18.14%) | 1,194 (9.44%) | 285 (4.17%) | |
| Timeout | 13,157 (60.16%) | 13,710 (78.66%) | 11,290 (89.29%) | 6,505 (95.27%) | |
| Ambiguous | 0 (0.00%) | 0 (0.00%) | 0 (0.00%) | 0 (0.00%) | |
| Position Sizes | Total position value | £223,498,978.72 | £135,432,072.83 | £74,706,143.45 | £28,666,203.15 |
| Largest position value | £46,689.80 | £23,461.27 | £13,467.97 | £7,512.54 | |
| Average position value | £10,219.90 | £7,770.06 | £5,908.43 | £4,198.33 | |
| Capital turnover | 44699.80x | 27086.41x | 14941.23x | 5733.24x | |
| Profitability Cross-Check | Wins | 9,652 (44.14%) | 7,871 (45.16%) | 5,529 (43.73%) | 2,798 (40.98%) |
| Losses | 12,208 (55.82%) | 9,559 (54.84%) | 7,115 (56.27%) | 4,030 (59.02%) | |
| Breakevens | 9 (0.04%) | 0 (0.00%) | 0 (0.00%) | 0 (0.00%) | |
| Profit & Loss | Gross profit | £826,140.99 | £500,692.05 | £271,929.66 | £105,906.68 |
| Gross loss | £795,344.13 | £466,784.19 | £256,901.01 | £102,342.59 | |
| Profit factor | 1.04 | 1.07 | 1.06 | 1.03 | |
| Total commission | £131,214.00 | £104,580.00 | £75,864.00 | £40,968.00 | |
| Average R | 0.0153 | 0.0212 | 0.0130 | 0.0060 |
Summary
A small confirmation buffer helps, a large one hurts — 0.2% is the sweet spot.
Average R jumps from 0.0153 baseline to 0.0212, the best of the four, but push it to 0.5% or 1% and it degrades past baseline entirely (0.0130, then 0.0060), because you’re no longer filtering false breakouts, you’re just waiting so long that only exhausted moves are left to enter — visible directly in the timeout rate climbing from 60% to 95% across the sweep.
0.2% is the peak (average R is 0.0212), then it degrades steadily from there (0.0130, then 0.0060 at 1%, below even the baseline’s 0.0153). That’s actually a stronger, more useful finding than “higher buffer = worse” — it suggests a small confirmation buffer filters out genuine false breakouts, but past some point (between 0.2% and 0.5%) you’re no longer filtering noise, you’re just waiting so long that only the already-exhausted moves are left to enter into, which lines up with timeout rate climbing to 95.27% at 1%.
One more thing to note: net result (gross minus commission) is -£100,417 → -£70,672 → -£60,835 → -£37,404 — monotonically improving even past the 0.2% average-R peak, purely because fewer trades entered means less commission drag. That’s a different, size-dependent story from average R and worth not conflating with it — average R tells you about signal quality, net £ tells you about cost drag, and past 0.2% they’re pulling in opposite directions.