 GECKO
GECKOThe Baseline Strategy
I want to establish a deliberately simple ORB baseline on which to use for comparison with later backtests.
The objective is not to produce the best possible ORB strategy. It is to create a stable reference point against which every subsequent change can be measured.
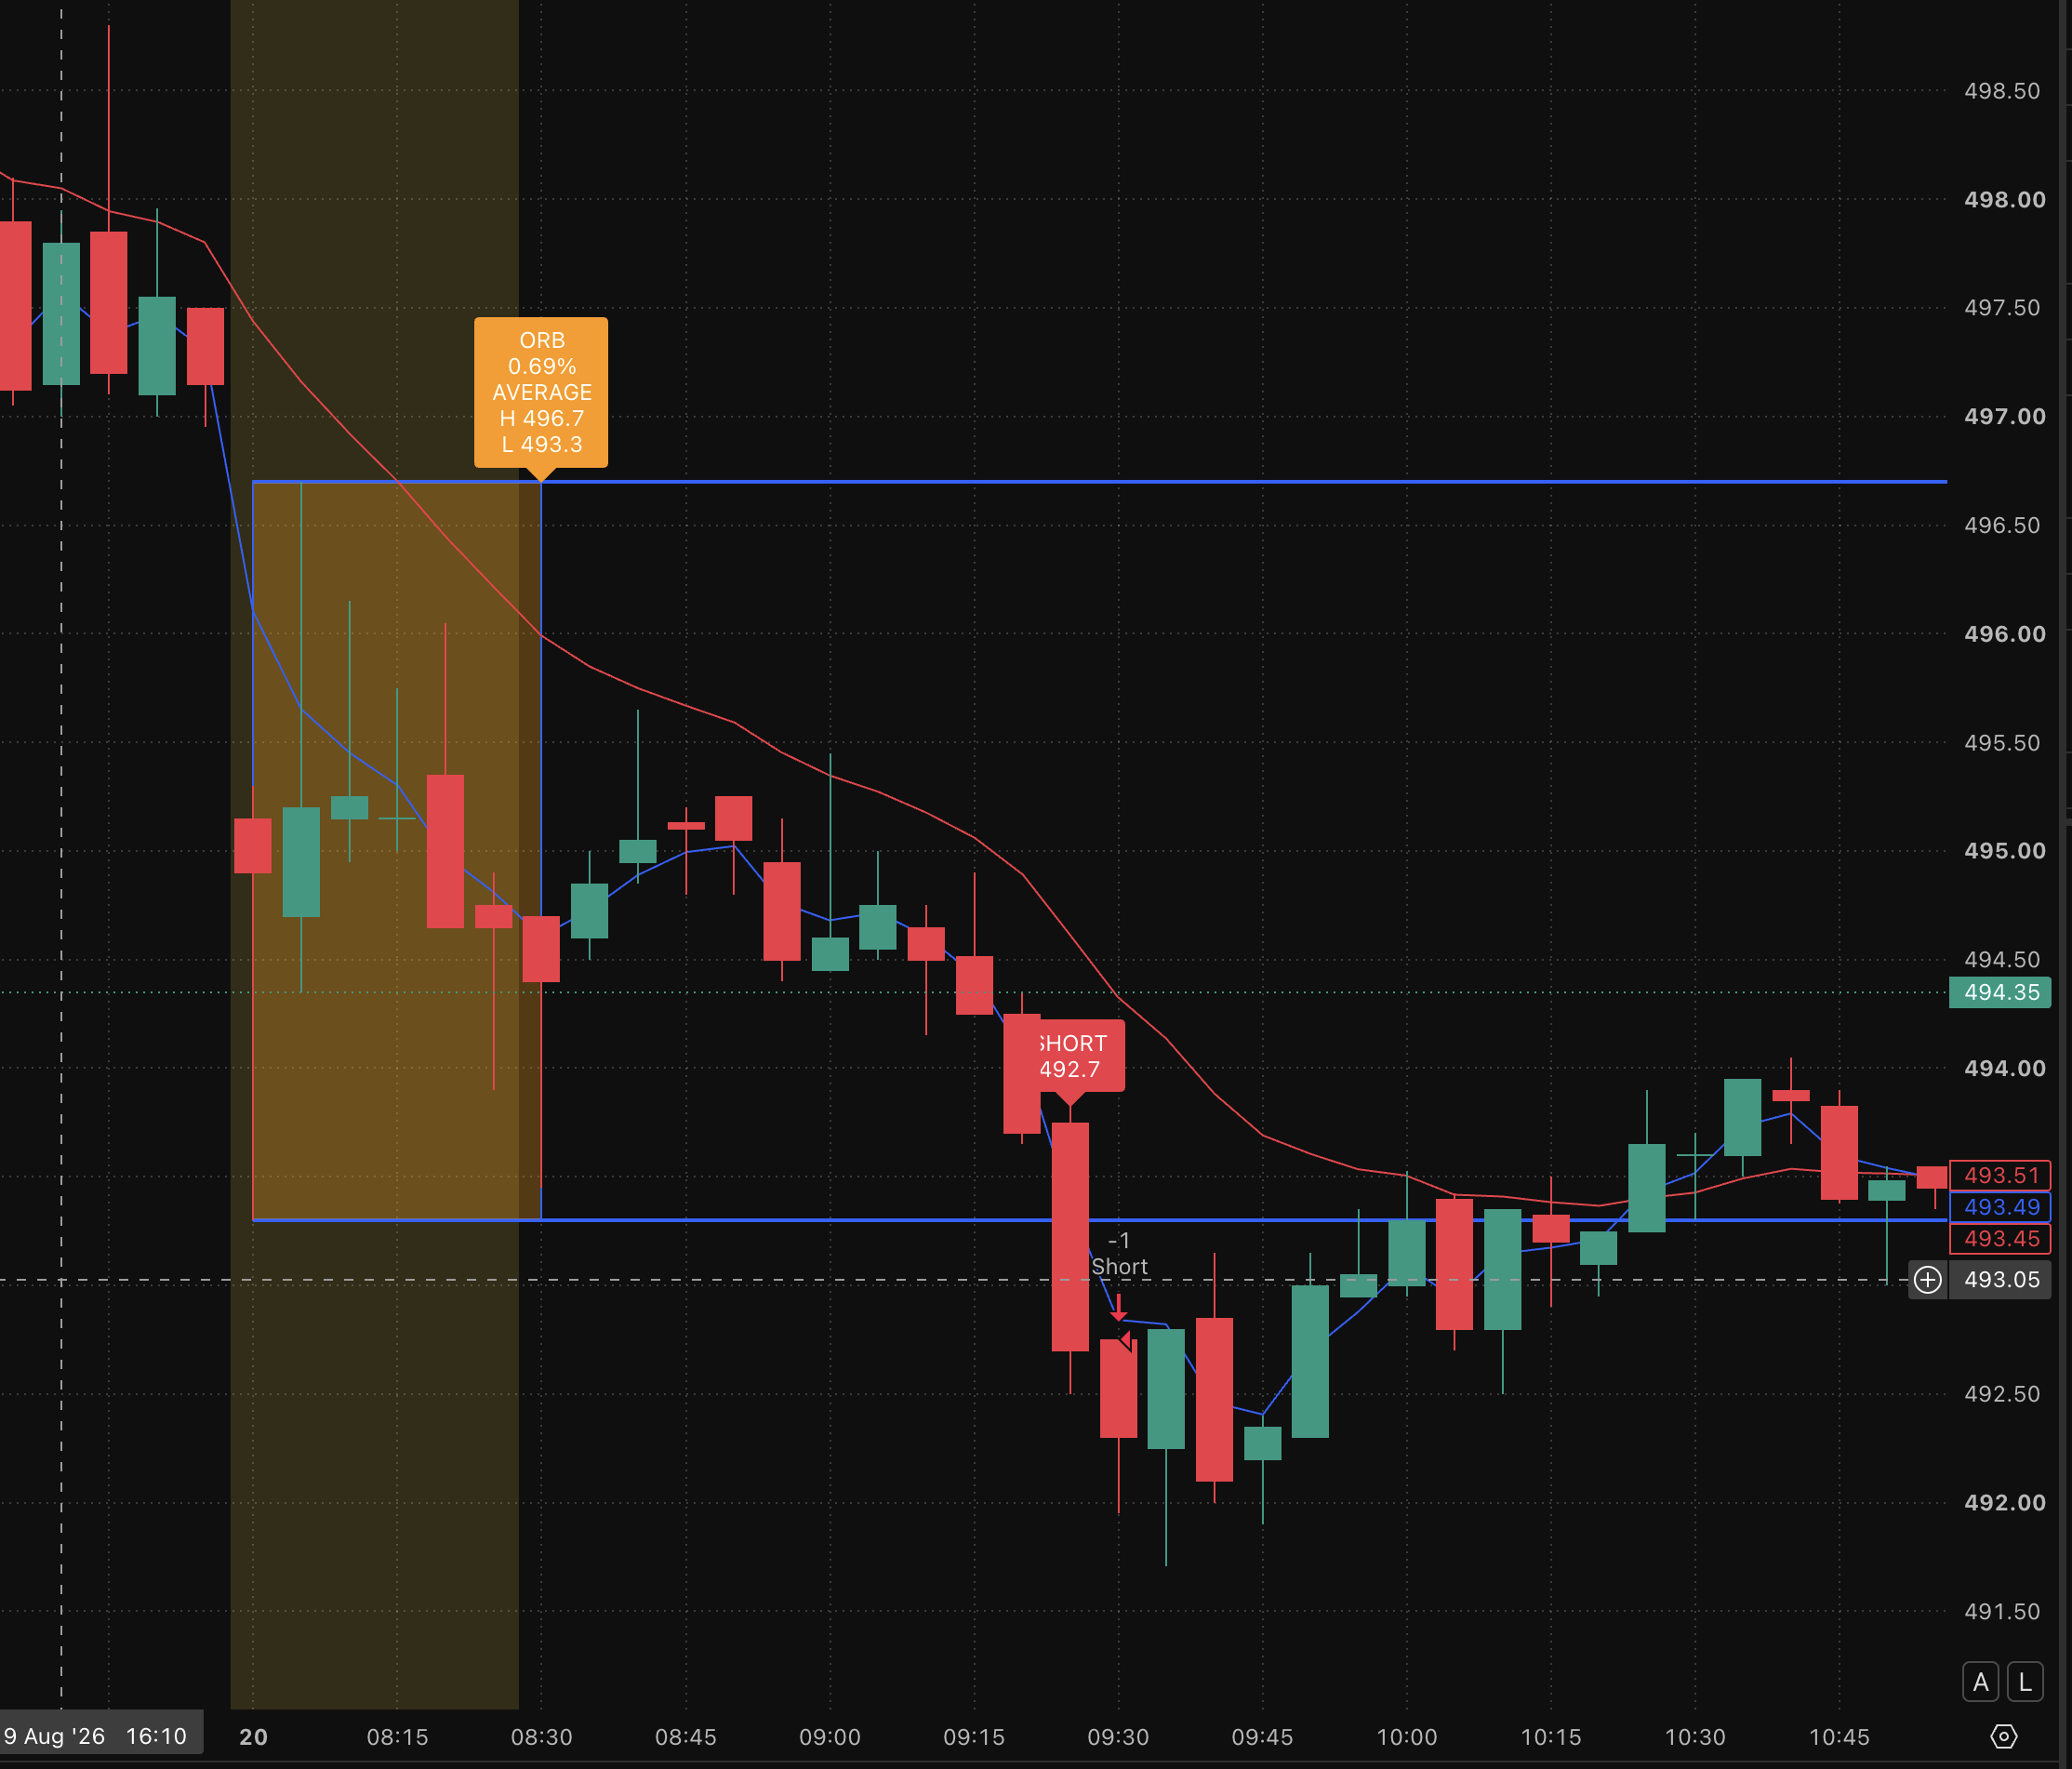
Example of an Opening Range Breakout. The opening range is established during the first 30 minutes of trading before price subsequently breaks outside it. In this case the breakout happened on the short side at 09:25.
What Counts as a Breakout?
A breakout occurs when the first 5-minute candle after the opening range closes outside the opening-range high or low. A close above the opening-range high produces a long signal. A close below the opening-range low produces a short signal.
Importantly, simply trading beyond the boundary during a candle is not enough. For example, if price moves above the opening-range high but subsequently retreats and the 5-minute candle closes back inside the range, Gecko does not consider that a breakout.
The first qualifying closing breakout before 11:00 determines the trade direction.
Entry
For the baseline I am simply using a market order upon breakout.
Exit
- The Stop Loss is set as the opposite side of the opening-range to the breakout.
- The Take Profit is simply twice the distance of the Stop Loss.
- A trade is recorded as a timeout IF neither of the above are triggered by the close of the trading day.
Settings
| Setting | Value |
|---|---|
| Opening range | 08:00–08:30 |
| Signal timeframe | 5 minutes |
| Breakout window | 08:30–11:00 |
| Direction | Long or short |
| Entry | Market at breakout candle close |
| Entry buffer | None |
| Opening-range size restriction | None |
| Previous-day filter | None |
| Support/resistance filter | None |
| Indicator confirmation | None |
| Volume-profile filter | None |
| Reward/risk | 2:1 |
Scope
All tests were run against the LSE stocks and dates detailed here.
Backtest #88 Results
| Category | Metric | Value |
|---|---|---|
| Trade Activity | Trade plans | 21,869 |
| Trades entered | 21,869 (100.00%) | |
| Not triggered | 0 | |
| Execution Outcomes | Take profit | 1,813 (8.29%) |
| Stop loss | 6,899 (31.55%) | |
| Timeout | 13,157 (60.16%) | |
| Ambiguous | 0 (0.00%) | |
| Position Sizes | Total position value | £223,498,978.72 |
| Largest position value | £46,689.80 | |
| Average position value | £10,219.90 | |
| Capital turnover | 44699.80x | |
| Profitability Cross-Check | Wins | 9,652 (44.14%) |
| Losses | 12,208 (55.82%) | |
| Breakevens | 9 (0.04%) | |
| Profit & Loss | Gross profit | £826,140.99 |
| Gross loss | £795,344.13 | |
| Profit factor | 1.04 | |
| Total commission | £131,214.00 | |
| Average R | 0.0153 |
Summary
This baseline strategy does not have an “edge”. It is statistically flat pre-cost, net-negative post-cost.
The headline numbers are misleading in isolation.
44.14% win rate against a 2:1 RR target looks comfortably above the ~33% breakeven line — but that comparison only holds if wins average close to +2R. They don’t: only 8.29% of trades ever reach full take-profit. The other ~36 points of “wins” are timeout closes that happened to be in profit, likely averaging well under +1R. Profit factor 1.04 confirms it: gross profit (£826k) barely edges out gross loss (£795k). That’s essentially a coin flip with a very slight bias, not a strategy with a real statistical edge.
Cost fragility is the real story
Gross edge is ~£30,797 across 21,869 trades — call it £1.41/trade average. Commission alone is £131,214 (£6/trade round-trip). That’s over 4x the entire gross edge. Net result: roughly −£100,417. The edge doesn’t just get eroded by costs, it gets inverted several times over.
Trade quality, not just win rate, is the problem 60.16% of trades time out rather than resolving cleanly to TP or SL. That’s the strategy not really deciding on most trades — price drifts without conviction until the session ends and you’re marked out wherever it happens to be. A strategy with real signal quality would show a higher share of clean TP/SL resolutions.