 GECKO
GECKOThe Hypothesis
The ORB baseline accepts all sizes of opening range. This test instead excludes the wider ones, using Gecko’s SMALL/MEDIUM/LARGE classification.
The question is: Can filtering out wider opening ranges from becoming eligible for trades improve the trading edge?
Background
How Gecko classifies opening range size
Every day’s opening range has a width — the gap between the high and low printed during the first 30 minutes of trading. The obvious way to measure that width is in absolute price terms (pence, dollars, whatever the instrument trades in), but that’s misleading across a universe of stocks trading at wildly different price levels. A 50p-wide range is enormous for a £2 stock (25% of the price) but utterly meaningless for a £5,000 stock (0.01%). Comparing those two numbers directly tells you nothing useful. So instead of measuring the range in absolute terms, Gecko expresses it as a percentage of that day’s opening price:
range width % = (opening range high − opening range low) ÷ opening price × 100
That one calculation is what makes the classification instrument-agnostic — a “SMALL” range means the same relative thing whether you’re looking at a cheap stock or an expensive one, because it’s always measured proportionally rather than in fixed price units.
From there, the percentage is bucketed into three tiers:
| Classification | Opening range width |
|---|---|
| SMALL | Under 50% of the opening price |
| MEDIUM | 50% up to (but not including) 100% |
| LARGE | 100% or more — no upper bound |
So a stock opening at £500 with an opening range of £2 wide (0.40%) would be classified SMALL, while a £5 stock with an opening range of 3p (0.60%) would be classified MEDIUM — the £2 move is much bigger in cash terms, but proportionally smaller, and it’s the proportional measure that determines the bucket.
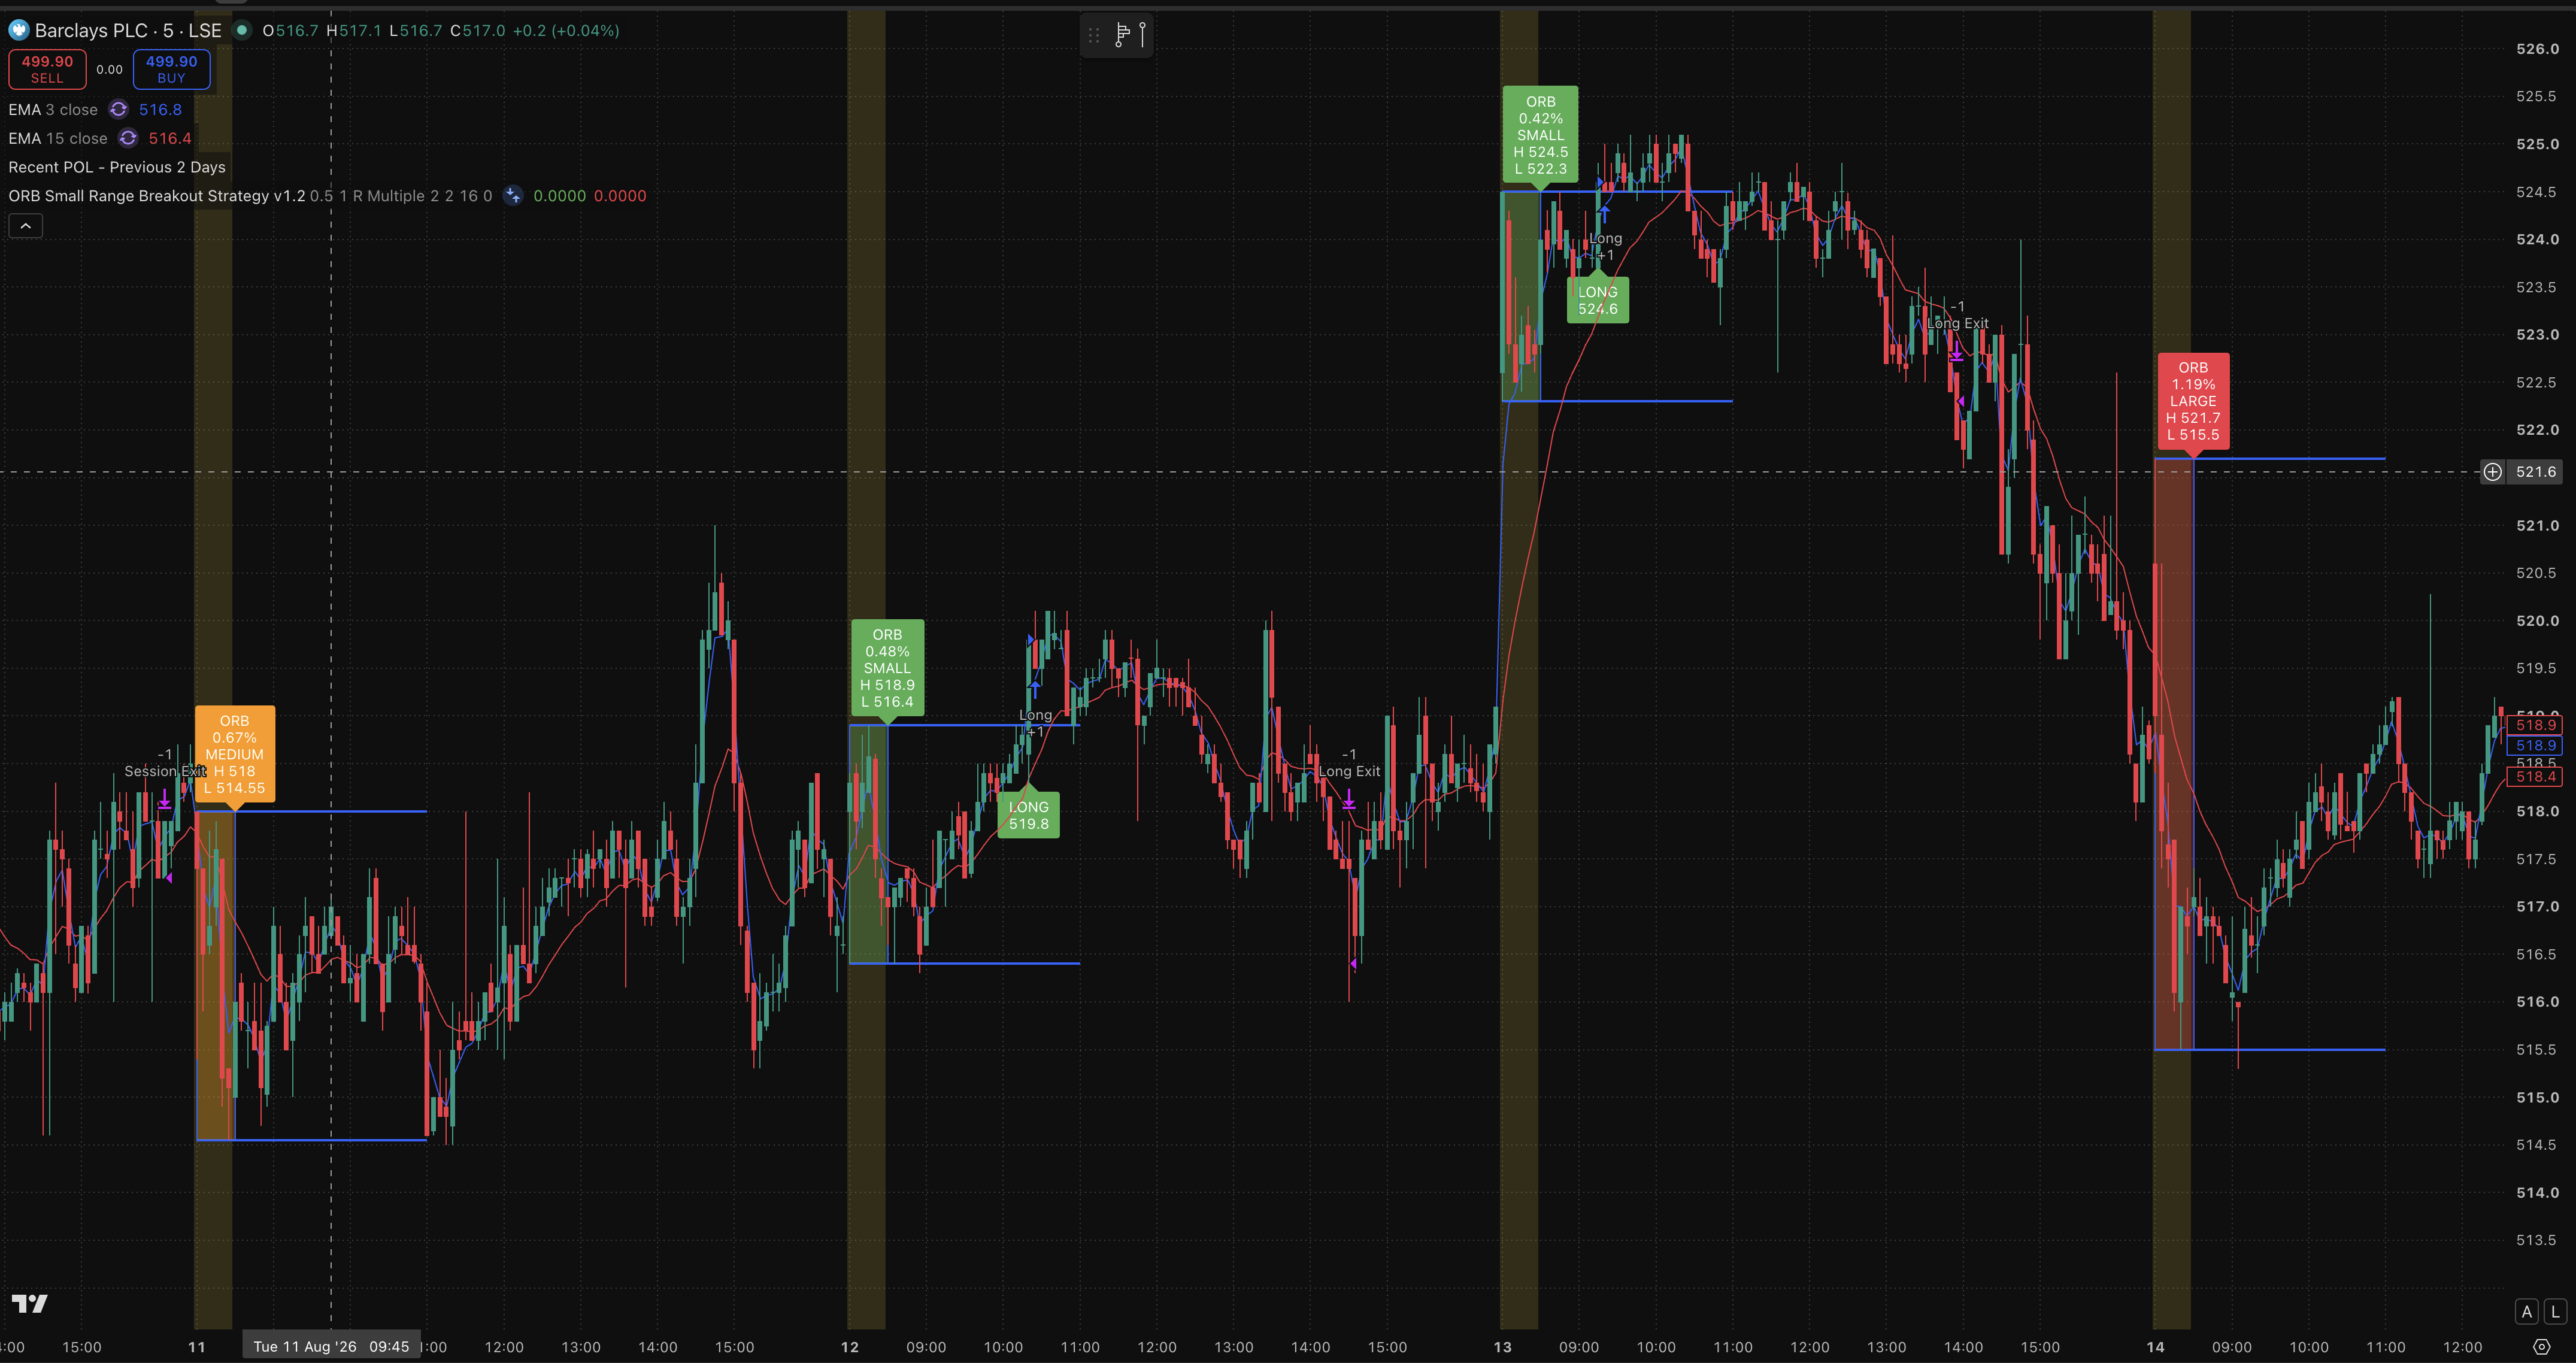
The above chart shows how Gecko can classify an Opening Range in to SMALL, MEDIUM or LARGE expressed as the size of the opening range divided in to the opening price
Settings
Exactly the same as the ORB baseline except LARGE opening ranges excluded, and then both MEDIUM and LARGE opening ranges excluded.
Scope
All tests were run against the LSE stocks and dates detailed here.
Backtest #100, #101 Results
The results below show the baseline results side-by-side with the tests here.
| Category | Metric | Baseline (#88) | Exclude LARGE (#100) | Exclude MEDIUM+LARGE (#101) |
|---|---|---|---|---|
| Trade Activity | Trade plans | 21,869 | 12,898 | 2,234 |
| Trades entered | 21,869 (100.00%) | 12,898 (100.00%) | 2,234 (100.00%) | |
| Not triggered | 0 | 0 | 0 | |
| Execution Outcomes | Take profit | 1,813 (8.29%) | 1,425 (11.05%) | 421 (18.85%) |
| Stop loss | 6,899 (31.55%) | 4,882 (37.85%) | 1,095 (49.02%) | |
| Timeout | 13,157 (60.16%) | 6,591 (51.10%) | 718 (32.14%) | |
| Ambiguous | 0 (0.00%) | 0 (0.00%) | 0 (0.00%) | |
| Position Sizes | Total position value | £223,498,978.72 | £169,275,086.32 | £44,530,892.53 |
| Largest position value | £46,689.80 | £46,689.80 | £46,689.80 | |
| Average position value | £10,219.90 | £13,124.13 | £19,933.26 | |
| Capital turnover | 44699.80x | 33855.02x | 8906.18x | |
| Profitability Cross-Check | Wins | 9,652 (44.14%) | 5,595 (43.38%) | 906 (40.56%) |
| Losses | 12,208 (55.82%) | 7,301 (56.61%) | 1,328 (59.44%) | |
| Breakevens | 9 (0.04%) | 2 (0.02%) | 0 (0.00%) | |
| Profit & Loss | Gross profit | £826,140.99 | £543,399.81 | £113,023.46 |
| Gross loss | £795,344.13 | £524,872.59 | £108,402.50 | |
| Profit factor | 1.04 | 1.04 | 1.04 | |
| Total commission | £131,214.00 | £77,388.00 | £13,404.00 | |
| Average R | 0.0153 | 0.0156 | 0.0221 |
Summary
Restricting the trading to just SMALL opening ranges produced the highest Average R yet. But the sample size is so small due to the restricted number of trades that we need to treat the results cautiously.
The improvement is concentrated entirely in the most restrictive test #101, not gradual. Excluding just LARGE (run 100) barely moves average R at all (0.0153→0.0156, essentially a rounding-level change) despite cutting trade count nearly in half.
All of the real edge shows up only when you go further and exclude MEDIUM too (run 101): 0.0221, a genuine +44% jump over baseline — in fact the best average R of the whole series so far, ahead of even the 0.2% buffer test’s 0.0212.
The mechanism is the same one we’ve seen before: tighter opening ranges mean tighter stops and closer targets, so trades resolve faster instead of timing out — timeout rate drops from 60.16% to 32.14% while both TP and SL rates rise together (the same “clean, mechanically-explained” pattern as the 15-minute range test).
Two caveats worth stating plainly rather than glossing over:
- Sample size collapses 90% — 21,869 trades down to 2,234. That’s a real result, not noise (the direction is consistent with the mechanism, and it isn’t a small nudge), but it’s also by far the smallest sample in the series, so it’s the least statistically robust number you’ve published. Worth a line in the post saying so rather than presenting 0.0221 with the same confidence as figures built on 20x more trades.
- Profit factor didn’t move at all — 1.04 in all three, identically. And the same position-sizing inflation from the 15-minute test shows up again here: average position value nearly doubles (£10,220 → £19,933) as the filter tightens, because narrower ranges mean tighter stops mean more shares bought per fixed risk unit. The dramatic net-£ improvement (−£100,417 → −£8,783) is doing a lot of work from collapsing commission (fewer trades), not purely from better trades — same “average R tells you about signal quality, net £ tells you about cost drag” distinction as the buffer post.
So: real finding, best average R yet, but it’s specifically “only the tightest opening ranges show an edge” rather than “restricting range size generally helps” — and it’s built on the thinnest evidence base of any result in the series, which is worth saying rather than hiding.