 GECKO
GECKOThe Hypothesis
The ORB baseline tests operate in a single-day bubble, ignorant of the price action in the days leading up to the trade. This test rejects a breakout if the recent trend runs against it — a LONG breakout with a bearish history, or a SHORT breakout with a bullish one.
The question is: Will discarding breakouts that run against a strong recent trend increase the trading edge?
Background
Gecko has a Trend analysis component that can use historic candle data to deduce whether there was a BULLISH, BEARISH or NEUTRAL trend prior to the potential day of trading, and classifies any detected trend according to its strength and percentage movement.
Trend Strength
Strength ranges from 0 to 1 and refers to the consistency of the trend and how little the price whipsawed. A strength of 1.0 means the trend was an exact straight line.
See the charts below for examples.
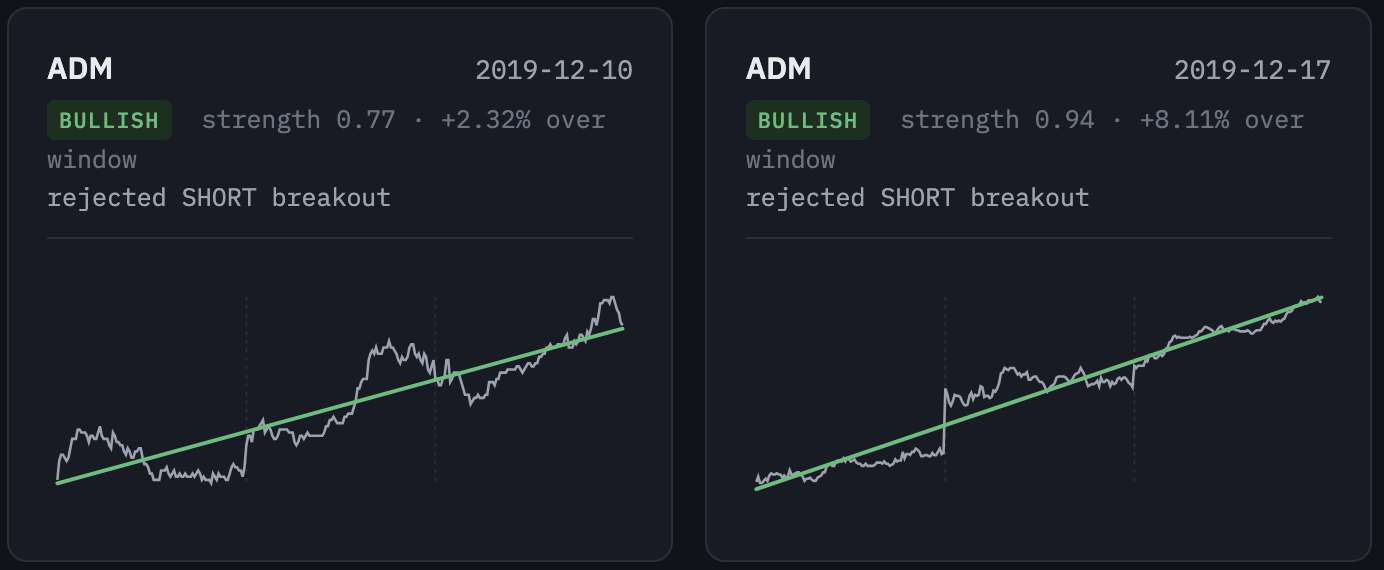
In the right-hand chart the price tracks the line more closely than the prices does in the left-hand chart. This gives it a greater strength score of 0.94
Trend percentage movement
This ranges from -100 to +100% where 0 is flat, -100% is a straight down drop and +100% is a straight up rise.
This could also be thought of as the angle of the line or how much the price changed over the timespan of the trend.
See the charts below for examples.
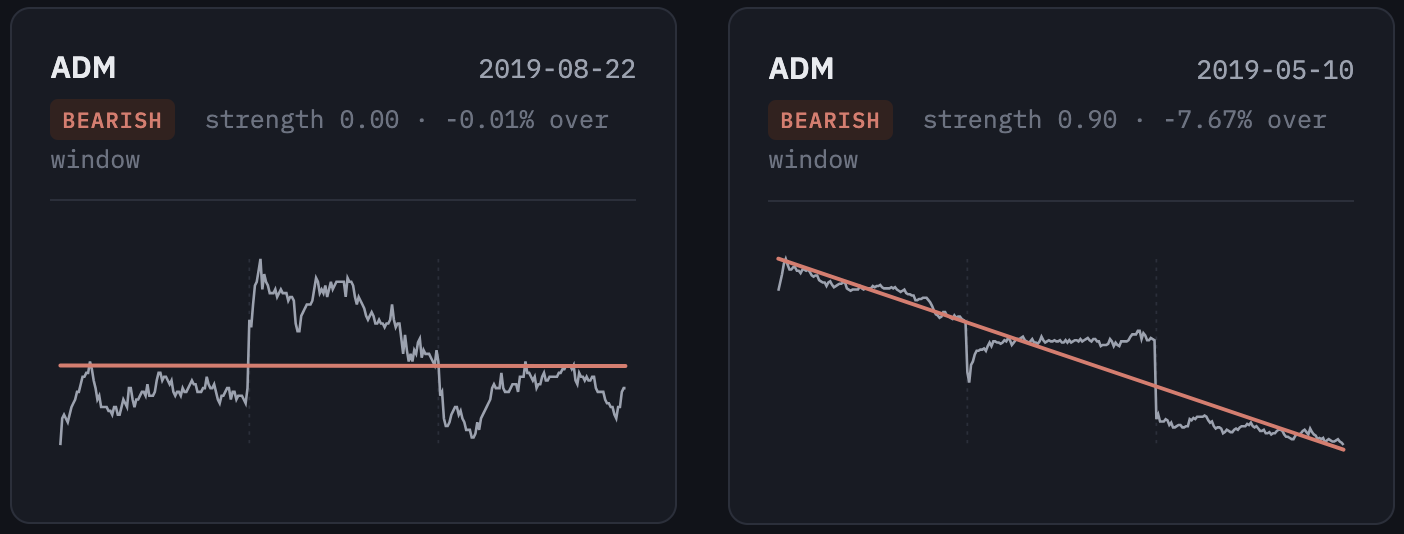
The left-hand chart shows minimal bearish trending so is only just under 0% whereas the steeper decline in the right-hand chart measures a much lower value of -7.67%
The strength and percentage movement combinator
I added a third config point for the backtests which relates to whether the conditions require either or both to be met. The trendVetoCombinator can be either AND or OR.
If it is set to AND then BOTH the trend strength AND the percentage movement must exceed their thresholds to potentially veto the trade.
If it is set to OR then EITHER the trend strength OR the percentage movement can exceed their thresholds to potentially veto the trade. The latter configuration is likely to exclude more trade entries as it is a looser condition.
Settings
Exactly the same as the ORB baseline except the trend filter is switched on and combined with a strength threshold, a percentage-move threshold, and a combinator deciding how the two combine — four variants below, changing one thing at a time.
Backtest #103
entry.orb.useTrendFilter=true
entry.orb.trendStrengthThreshold=0.5
entry.orb.trendPercentMoveThreshold=1.0
entry.orb.trendVetoCombinator=AND
Backtest #104
Same as #103, except use the OR combinator instead of the AND
entry.orb.useTrendFilter=true
entry.orb.trendStrengthThreshold=0.5
entry.orb.trendPercentMoveThreshold=1.0
entry.orb.trendVetoCombinator=OR
Backtest #105
Same as #104, except increase the percentage movement threshold from 1% to 2% (i.e. discard less trades as the trends have to be a bit stronger this time)
entry.orb.useTrendFilter=true
entry.orb.trendStrengthThreshold=0.5
entry.orb.trendPercentMoveThreshold=2.0
entry.orb.trendVetoCombinator=OR
Backtest #106
Same as #104, except decreased the percentage movement threshold from 1% to 0.5% (i.e. discard more trades as a greater number of trends can veto the trade)
entry.orb.useTrendFilter=true
entry.orb.trendStrengthThreshold=0.5
entry.orb.trendPercentMoveThreshold=0.5
entry.orb.trendVetoCombinator=OR
Scope
All tests were run against the LSE stocks and dates detailed here.
Results
The results below show the baseline results side-by-side with the four trend-filter variants tested here.
| Category | Metric | Baseline (#88) | AND 1% (#103) | OR 1% (#104) | OR 2% (#105) | OR 0.5% (#106) |
|---|---|---|---|---|---|---|
| Trade Activity | Trade plans | 21,869 | 17,264 | 14,767 | 16,373 | 13,338 |
| Trades entered | 21,869 (100.00%) | 17,264 (100.00%) | 14,767 (100.00%) | 16,373 (100.00%) | 13,338 (100.00%) | |
| Not triggered | 0 | 0 | 0 | 0 | 0 | |
| Execution Outcomes | Take profit | 1,813 (8.29%) | 1,441 (8.35%) | 1,233 (8.35%) | 1,368 (8.36%) | 1,119 (8.39%) |
| Stop loss | 6,899 (31.55%) | 5,457 (31.61%) | 4,652 (31.50%) | 5,163 (31.53%) | 4,204 (31.52%) | |
| Timeout | 13,157 (60.16%) | 10,366 (60.04%) | 8,882 (60.15%) | 9,842 (60.11%) | 8,015 (60.09%) | |
| Ambiguous | 0 (0.00%) | 0 (0.00%) | 0 (0.00%) | 0 (0.00%) | 0 (0.00%) | |
| Position Sizes | Total position value | £223,498,978.72 | £179,280,985.17 | £156,456,797.56 | £172,084,773.10 | £140,713,316.52 |
| Largest position value | £46,689.80 | £46,689.80 | £46,689.80 | £46,689.80 | £46,689.80 | |
| Average position value | £10,219.90 | £10,384.67 | £10,595.03 | £10,510.28 | £10,549.81 | |
| Capital turnover | 44,699.80x | 35,856.20x | 31,291.36x | 34,416.95x | 28,142.66x | |
| Profitability Cross-Check | Wins | 9,652 (44.14%) | 7,660 (44.37%) | 6,550 (44.36%) | 7,263 (44.36%) | 5,916 (44.35%) |
| Losses | 12,208 (55.82%) | 9,597 (55.59%) | 8,210 (55.60%) | 9,103 (55.60%) | 7,416 (55.60%) | |
| Breakevens | 9 (0.04%) | 7 (0.04%) | 7 (0.05%) | 7 (0.04%) | 6 (0.04%) | |
| Profit & Loss | Gross profit | £826,140.99 | £656,711.59 | £565,515.99 | £624,605.95 | £511,431.76 |
| Gross loss | £795,344.13 | £627,967.37 | £536,339.51 | £594,784.32 | £484,207.64 | |
| Profit factor | 1.04 | 1.05 | 1.05 | 1.05 | 1.06 | |
| Total commission | £131,214.00 | £103,584.00 | £88,602.00 | £98,238.00 | £80,028.00 | |
| Average R | 0.0153 | 0.0178 | 0.0213 | 0.0195 | 0.0218 | |
| Net result | −£100,417.14 | −£74,839.78 | −£59,425.52 | −£68,416.37 | −£52,803.88 |
Summary
Rejecting a breakout that runs against a strong recent trend improved average R in every single configuration tested, and the best of them did it on a sample large enough to actually trust.
All four variants beat the baseline’s 0.0153 average R, but the shape of the results is the interesting part. AND (#103) — requiring both a strong and a big trend to veto — only lifted average R to 0.0178. Switching to OR (#104) at the exact same thresholds jumped it to 0.0213, because OR also catches the cases AND waves through: a trend that’s statistically clean but tiny, or a trend that’s big but noisy. Those mixed cases turned out to matter.
From there, tightening the percentage-move bar kept helping, not hurting. Loosening it to 2% (#105) made things worse (0.0195) — proof that trades in the 1–2% band with a weak trend really were the low-quality ones the filter was right to reject, not false positives. Tightening it to 0.5% (#106) pushed average R to 0.0218, the best of this batch, and gains were shrinking each step (0.0178 → 0.0213 → 0.0218), suggesting we’re approaching the point where there’s little left to gain from this lever alone.
0.0218 is nearly the best average R seen anywhere in the series so far — restricting to only the smallest opening ranges edged it out at 0.0221, but on a sample of just 2,234 trades. #106 gets almost the same number on 13,338 trades, six times the sample size, which makes it a far more credible result than anything before it.
None of this makes the strategy profitable yet — even the best net result here (−£52,803.88) is still a loss, and net £ is doing its usual thing of partly reflecting fewer trades and less commission drag rather than pure signal quality. But as a filter that improves trade quality on a real sample, this is the strongest result in the series to date.