 GECKO
GECKOThe Hypothesis
The ORB baseline uses a 30 minute opening-range period. This test instead uses a 15 minute opening range, a narrower window some ORB traders prefer.
The question is: Will reducing the Opening Range period from 30 to 15 mins increase the trading edge?
Background
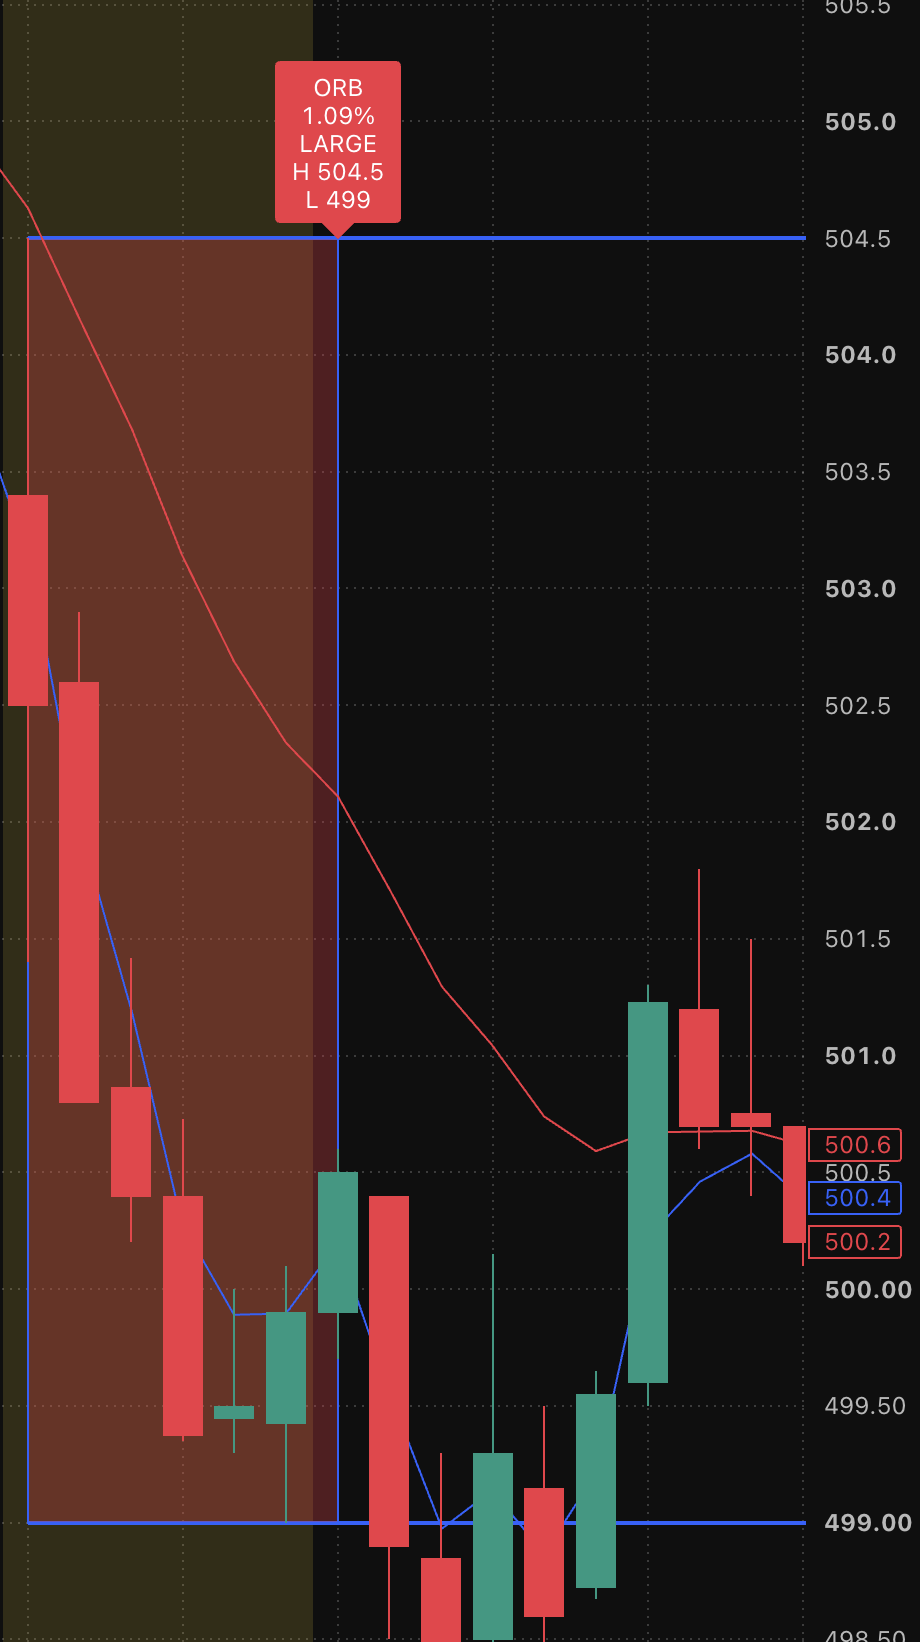
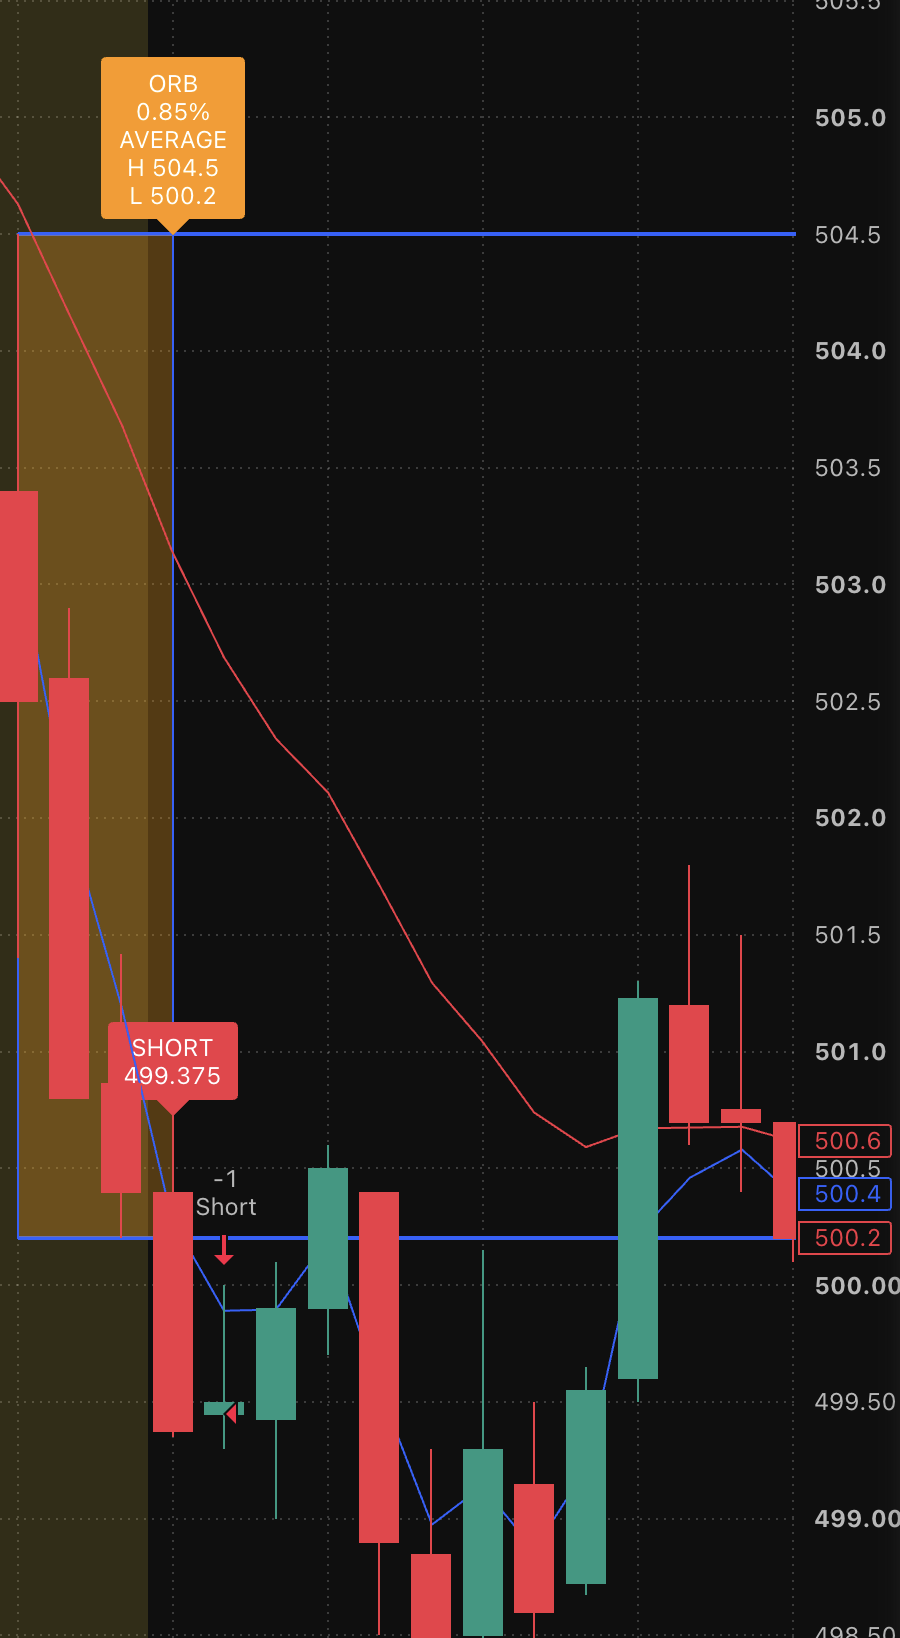
Why 15 minutes might do better A 15-minute range should be narrower than a 30-minute one (~70% the width, under a square-root-of-time scaling), which tightens the stop and pulls the take-profit target closer in absolute price terms.
Why 15 minutes might do worse Noisier boundary. Half the candles (3 vs 6) means the high/low defining the range rests on a much smaller sample. It’s more exposed to being set by a single spike or opening-auction wick rather than genuine consolidation — which risks defining “the range” around transient noise instead of a settled level. The first 15 minutes may not have settled yet. Some ORB practitioners deliberately wait 30+ minutes specifically because the opening auction’s imbalance-unwind and elevated spread/volatility haven’t normalised yet — a 15-minute range risks being auction churn, not a real balance area.
Settings
Exactly the same as the ORB baseline except with a 15 minute opening range
Scope
All tests were run against the LSE stocks and dates detailed here.
Backtest #98 Results
The results below show the baseline results side-by-side with the test here.
| Category | Metric | Baseline (#88) | 15min Range (#98) |
|---|---|---|---|
| Trade Activity | Trade plans | 21,869 | 24,271 |
| Trades entered | 21,869 (100.00%) | 24,271 (100.00%) | |
| Not triggered | 0 | 0 | |
| Execution Outcomes | Take profit | 1,813 (8.29%) | 2,876 (11.85%) |
| Stop loss | 6,899 (31.55%) | 9,167 (37.77%) | |
| Timeout | 13,157 (60.16%) | 12,227 (50.38%) | |
| Ambiguous | 0 (0.00%) | 1 (0.00%) | |
| Position Sizes | Total position value | £223,498,978.72 | £277,647,647.74 |
| Largest position value | £46,689.80 | £97,008.00 | |
| Average position value | £10,219.90 | £11,439.48 | |
| Capital turnover | 44699.80x | 55529.53x | |
| Profitability Cross-Check | Wins | 9,652 (44.14%) | 10,456 (43.08%) |
| Losses | 12,208 (55.82%) | 13,808 (56.89%) | |
| Breakevens | 9 (0.04%) | 6 (0.02%) | |
| Profit & Loss | Gross profit | £826,140.99 | £1,026,021.60 |
| Gross loss | £795,344.13 | £989,430.49 | |
| Profit factor | 1.04 | 1.04 | |
| Total commission | £131,214.00 | £145,626.00 | |
| Average R | 0.0153 | 0.0165 |
Summary
A reduced opening range of 15 minutes did not improve the trading edge.
The “tighter range, closer target” hypothesis held up. Timeout rate dropped from 60.16% to 50.38%, with both TP rate (8.29%→11.85%) and SL rate (31.55%→37.77%) picking up the slack — exactly the mirror image of what widening the buffer did. Tighter opening range → tighter stop → closer take-profit → more trades actually resolve one way or the other instead of running out of candles. That’s a clean, mechanically-explained result, not noise.
But it’s a much weaker lever than the buffer confirmation was. Average R moved 0.0153 → 0.0165 — about a 8% relative gain, versus the ~39% gain from the 0.2% buffer test. Profit factor didn’t move at all (1.04→1.04). Win rate actually dipped slightly (44.14%→43.08%). So while the mechanism worked as predicted, the magnitude is modest — this isn’t in the same league as the confirmation-buffer finding.
Net result got worse, not better (−£100,417 → −£109,035), despite average R improving. The reason is trade count: a tighter range is easier to break out of (more noise crosses it), so trade plans rose 11% (21,869→24,271), and with a flat £6 commission per trade, that’s an 11% jump in total commission (£131,214 → £145,626) — outrunning the small per-trade edge improvement. Worth stating plainly in the post: a per-trade quality metric (average R) and a portfolio-level cost metric (total commission) can move in opposite directions, and this run is a good real example of exactly that.