 GECKO
GECKO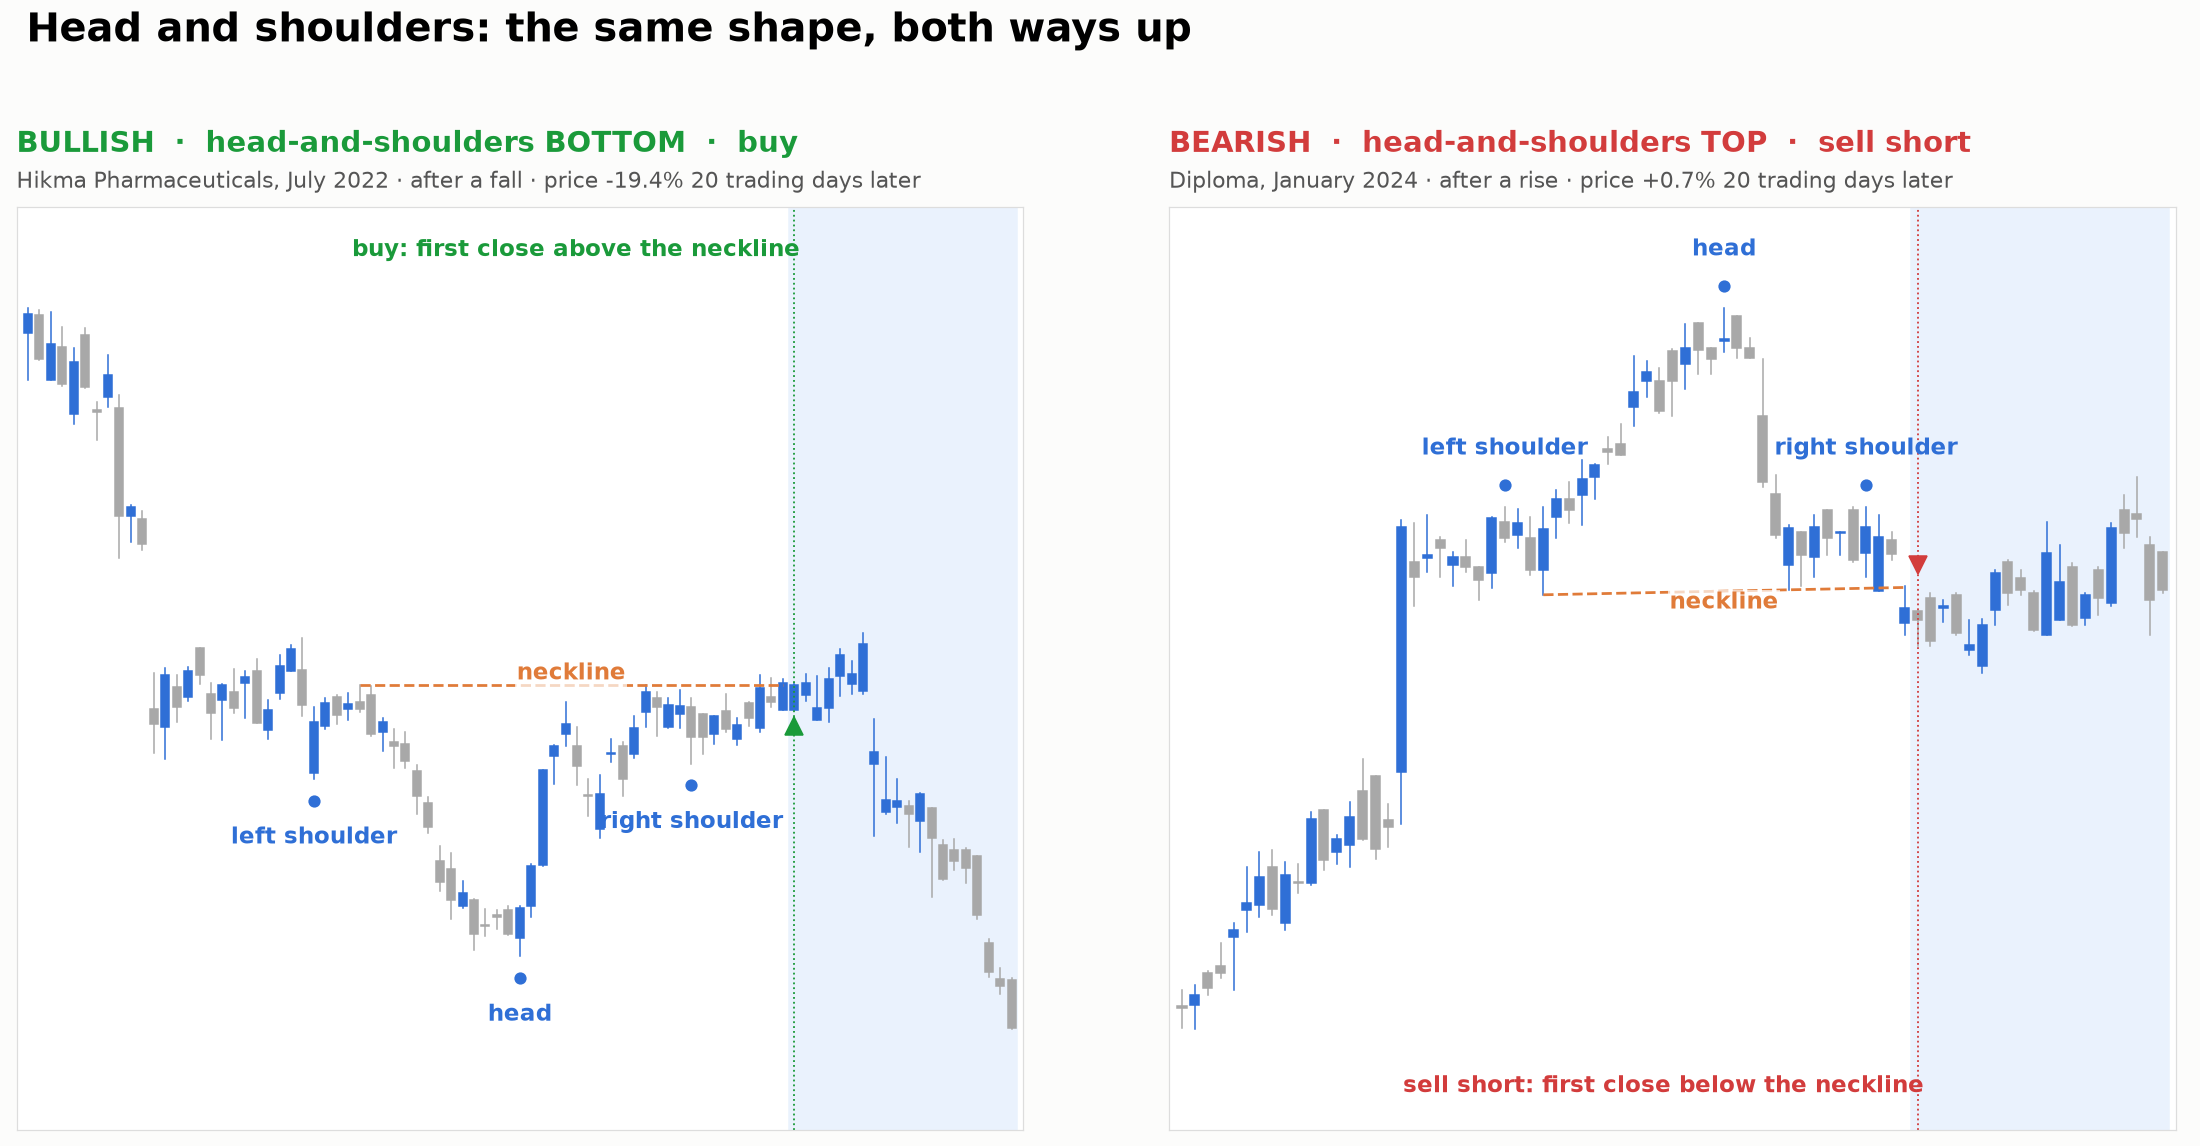
TL;DR
- One shape, two signals. The top (bearish) is three peaks after a rise, the head highest - sell short when price breaks down through the neckline. The bottom (bullish) is the same shape upside down after a fall, the head the lowest dip - buy when price breaks up through the neckline. The header shows one of each.
- Built by the book: Gecko followed Jack Schwager’s Getting Started in Technical Analysis to the letter - including his two warnings: don’t act before the neckline breaks, and ignore the shape unless it follows a major price move.
- Plenty of examples: 955 bottoms and 983 tops in UK stocks over ten years. They look convincing.
- No edge either way: every bottom version lost a little after costs. The top did slightly better on the stocks Gecko was developed on, but lost on every version on stocks it had never seen - the sign of luck, not an edge.
The pattern
The head-and-shoulders is probably the best-known chart formation of all. Most people picture the top: three peaks after a rise, the head poking up highest, and a sell when price breaks down through the neckline - a bearish signal that an uptrend is over. The bottom is the same shape upside down after a fall: the head is the lowest dip, not the highest peak, and the signal is a break up through the neckline - a bullish signal that a downtrend is over. This post tests the bottom first, then the top.
The bottom (bullish) version tells a story of sellers running out of steam: a fall to a low (the left shoulder), a bounce, a lower low (the head) as the last sellers give up, another bounce, and then a higher low (the right shoulder) where buyers step in earlier than before. The neckline joins the two bounce highs. Breaking above it is meant to confirm that the trend has turned.
Schwager is clear about two things. The most common novice mistake is to anticipate the pattern - buying before the neckline breaks. And a shape that looks like a head and shoulders but doesn’t follow a major move can be misleading. Gecko built both rules in.
Turning it into rules
| The eye sees | Gecko’s rule (daily candles) |
|---|---|
| A major move first | a fall of at least 15% from the 60-day high before the left shoulder (25% and 5% also tested) |
| Three troughs | three genuine swing lows (each the lowest point of the 3 days either side), at least 5 days apart, the whole pattern within 80 days |
| A head below the shoulders | the head at least 3% below both shoulders; the shoulders within 8% of each other |
| A neckline | a straight line through the highest high between each pair of troughs, extended forward |
| Confirmation | the first close above the neckline - then buy at the next open |
Writing the rules found one trap for code: the first version sometimes took a point partway down the slide into the head as the “left shoulder”. Requiring every trough to be a real turning point fixed it.
What it found
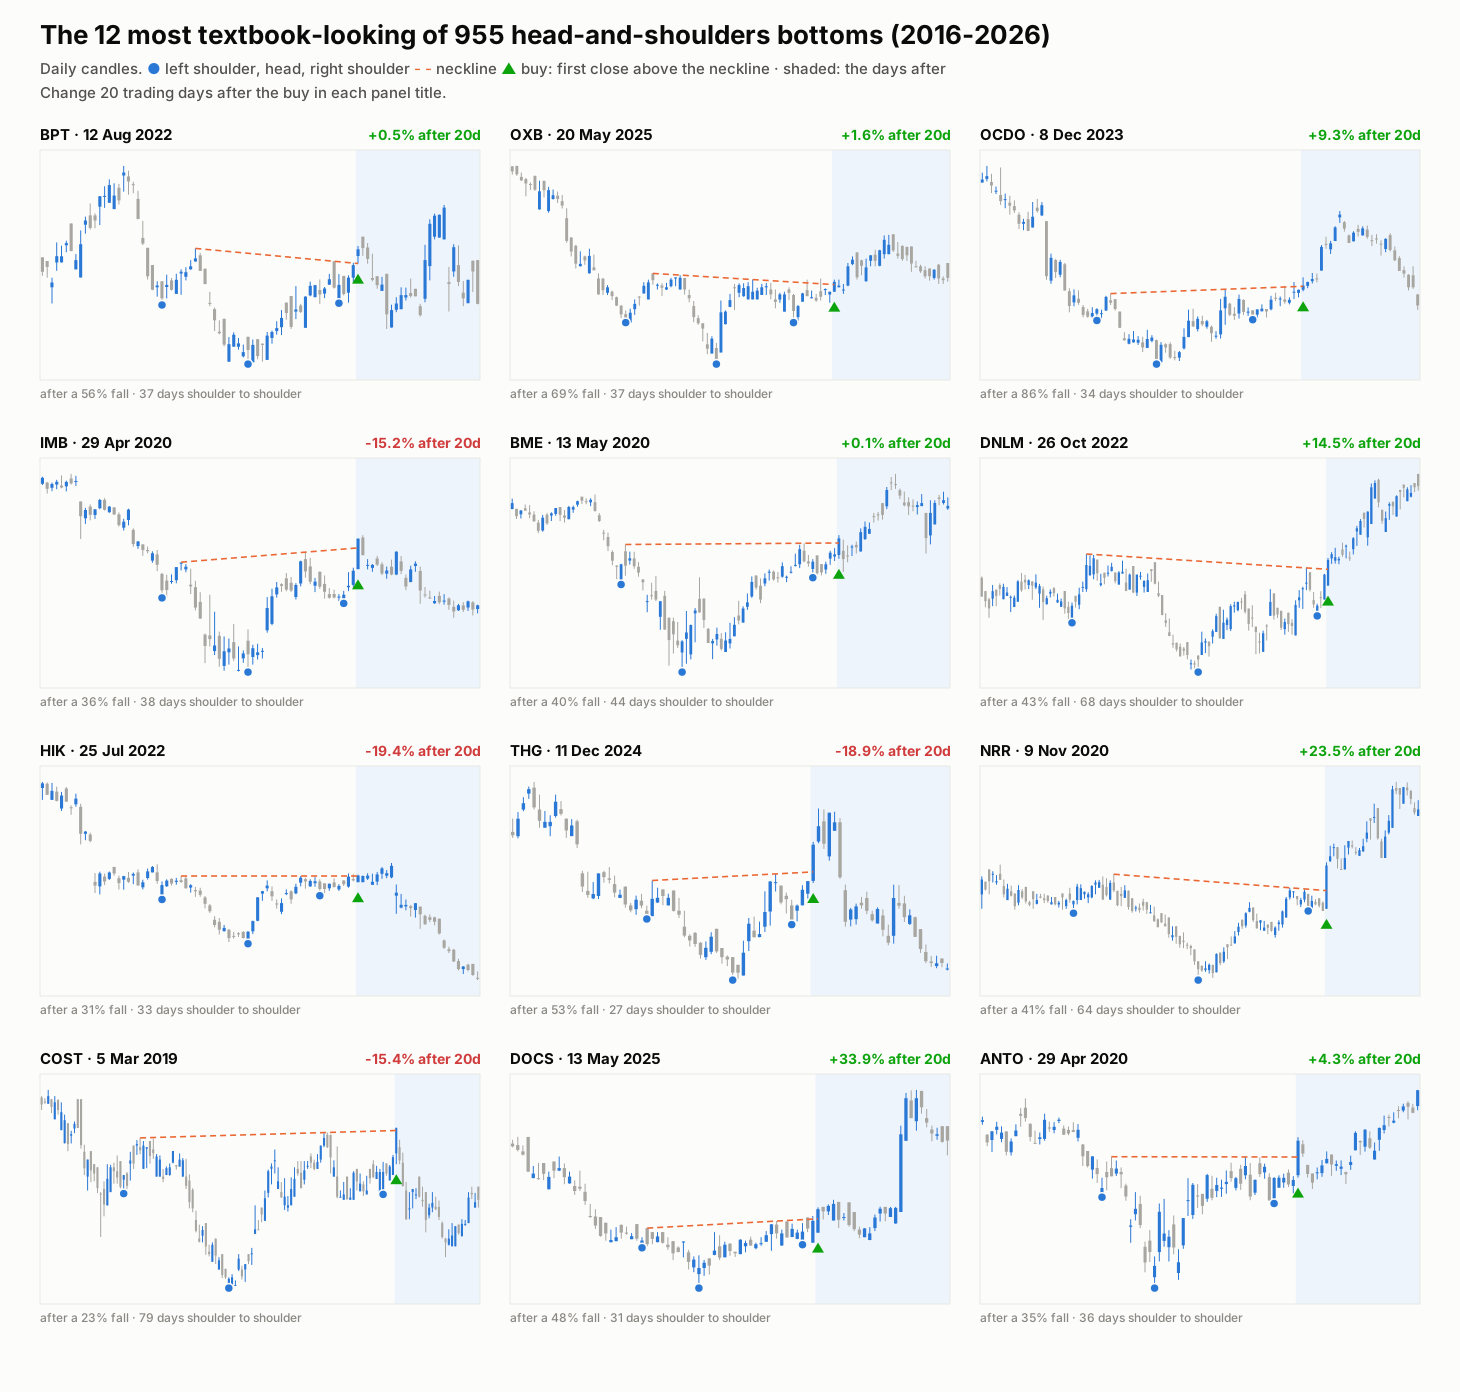
These are the twelve detections that score best on looking like the textbook picture: level shoulders, a clearly deeper head, a flat neckline and a big fall beforehand. They do look like head-and-shoulders bottoms. And twenty trading days after the buy they went anywhere: Dr. Martens +34%, NewRiver REIT +24% and Dunelm +15% - but Hikma -19%, THG -19% and Imperial Brands -15%. That spread is the whole story in miniature.
Did the bottom (bullish) work?
Tested with Gecko’s daily-candle engine as CFDs (buy at the next open, realistic costs and overnight financing), on the 109 stocks Gecko’s strategies were developed on and, separately, on 141 FTSE 350 companies it had never seen. Results are average profit per trade in units of risk (R), after costs; “beats random” is how often the real trades beat the same number of trades placed on random days in the same stocks.
| Version | Developed-on stocks (109) | Never-seen stocks (141) |
|---|---|---|
| Stop under the right shoulder, hold 20 days | -0.05R (411 trades) | -0.06R (460) |
| Wider stop (2.5x the average daily range), hold 20 days | -0.02R · beats random 57% | -0.05R · beats random 34% |
| …only after a 25%+ fall | -0.01R · beats random 60% | -0.18R · beats random 0.7% |
| …only after a 5%+ fall | -0.00R · beats random 73% | -0.02R · beats random 54% |
| …hold 10 days | -0.03R | -0.01R |
| …hold 40 days | -0.05R | -0.08R |
What this says:
- It loses, a little, everywhere. Twelve combinations, two separate sets of stocks, 200-680 trades each - not one made money after costs.
- It’s no better than a coin toss. A real edge would beat random entries most of the time; this pattern beats them about half the time, and sometimes much less.
- The textbook’s “major move” rule doesn’t rescue it. Demanding a bigger fall first should, on Schwager’s logic, give stronger signals. On the stocks Gecko had never seen it did the opposite - the worst result in the table.
This matches what Gecko found earlier with the academic version of the same pattern from Lo, Mamaysky and Wang, which had neither of Schwager’s rules: no edge then, and adding the rules hasn’t created one.
The top (bearish): the version most people know
The top is the exact mirror image, and Gecko built it that way: three swing highs, the head at least 3% above both shoulders, the shoulders within 8% of each other, the neckline through the lowest lows between them, and a short sale at the next open after the first close below the neckline - only after a rise of at least 15% from the 60-day low. The stop sits above the right shoulder (or 2.5x the average daily range above the signal close), and a short CFD position pays commission and the broker’s financing margin but is credited the interest rate. It found 983 tops.
These were tested with a replica of Gecko’s daily screen (same entry, exits, CFD costs and five-positions limit). Run on the bottom, the replica lands within about 0.05R of the table above - a touch worse, on slightly fewer trades - so the two are fair to compare.
| Version (top, sell short) | Developed-on stocks | Never-seen stocks (141) |
|---|---|---|
| Stop above the right shoulder, hold 20 days | +0.00R (318 trades) | -0.16R (382) |
| Wider stop (2.5x the average daily range), hold 20 days | -0.01R · beats random 84% | -0.05R · beats random 68% |
| …only after a 25%+ rise | +0.07R · beats random 95% | -0.09R · beats random 43% |
| …only after a 5%+ rise | +0.03R · beats random 96% | -0.05R · beats random 74% |
| …hold 10 days | -0.00R | -0.08R |
| …hold 40 days | -0.08R | -0.16R |
What this says:
- A flicker on familiar stocks, nothing on new ones. On the stocks Gecko was developed on, two versions made a little money and the tops beat random short sales most of the time. On the 141 it had never seen, every version lost - the same split that turned out to be luck in earlier tests.
- Beating random shorts is a low bar. UK shares have drifted upwards over the decade, so shorting on random days loses steadily; a pattern can beat that and still lose money, as most versions here do.
- The example in the header is typical. Diploma’s January 2024 top is as textbook as they come - a long rise, a clear head, level shoulders on a flat neckline - and twenty days after the short the price was 0.7% higher.
Verdict
Fail - both ways up. The head-and-shoulders, bottom or top, is easy to see, Gecko can find it reliably, and it fails as a trading signal on UK stocks - even built carefully by the book. It joins the cup and handle, bull flags, sideways breakouts and double bottoms on the list of famous shapes that don’t pay. The pattern so far is consistent: in Gecko’s tests, shapes on a price chart don’t move prices; news does - and the one place Gecko keeps finding an edge is in what volume says about it.