 GECKO
GECKO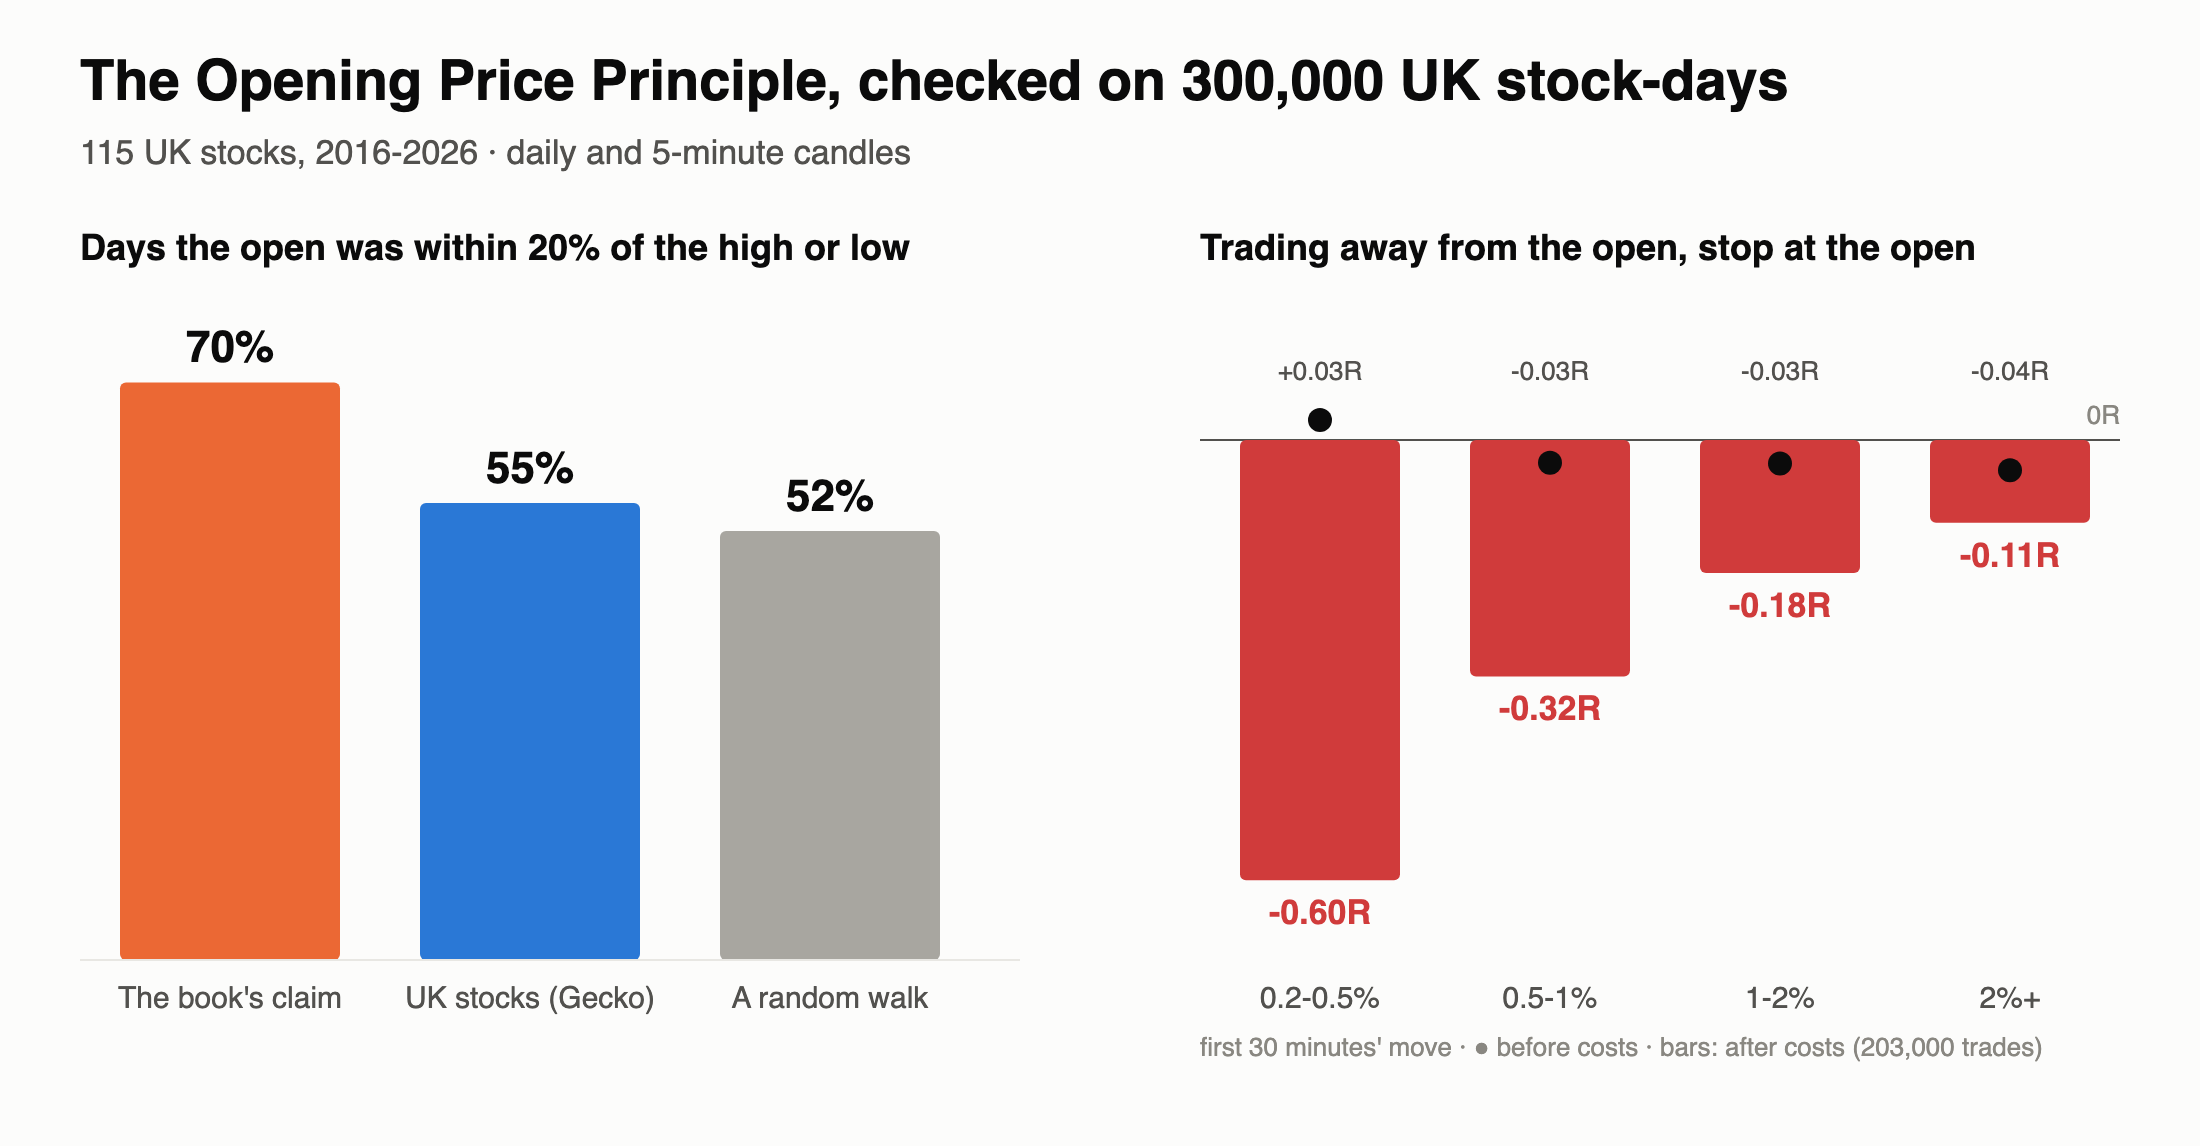
TL;DR
- The claim: Larry Pesavento and Peggy MacKay’s workbook The Opening Price Principle says the open is very near the day’s high or low about 70% of the time, so you can trade in the direction price moves away from the open and use the open as your stop.
- Not 70%, and barely better than chance: on UK stocks it happened 55% of the time - and a completely random price path does it 52% of the time.
- Trading it loses: going with the move away from the open, stop at the open, made about nothing before costs over 203,000 trades, and lost after costs.
Why chance gets you most of the way
Draw any wiggly line from left to right and look at where it started. Its starting point is quite often near its highest or lowest point - because the line has only had time to move away in one direction for a while before it turns. That’s pure geometry, not market behaviour. Gecko simulated a random price path with 102 steps (one per 5-minute bar in a London trading day) many thousands of times: the start finished within 20% of the day’s range from an extreme 52% of the time.
Checking by eye - circling the opens on a chart, as the book suggests - can’t tell that apart from a genuine effect.
What Gecko found
| Open within 20% of the high or low | Open within 10% | |
|---|---|---|
| The book’s claim | 70% | - |
| UK stocks, 2016-2026 (115 stocks, 300,128 days) | 55% | 40% |
| A random walk | 52% | 32% |
There is a small genuine excess, mostly in the open being very close to an extreme (40% against 32%). The question is whether it’s enough to trade.
Trading it
The book’s suggestion, tested on 5-minute candles: at 08:30, half an hour after the open, go in the direction price has moved from the open, put the stop-loss at the opening price, and close at the end of the day. Costs are CFD commission plus spread, about 0.2% for the round trip.
| First 30 minutes’ move | Trades | Stopped out | Before costs | After costs |
|---|---|---|---|---|
| 0.2-0.5% | 63,586 | 75% | +0.03R | -0.60R |
| 0.5-1% | 63,516 | 57% | -0.03R | -0.32R |
| 1-2% | 47,780 | 37% | -0.03R | -0.18R |
| 2% or more | 28,610 | 17% | -0.04R | -0.11R |
Before costs the result is essentially zero whichever way the morning went: the open doesn’t act as a barrier that prices respect more than chance would. After costs it loses, and the smaller the early move, the worse it gets - because the stop (the open) sits close to the entry, so the same 0.2% cost is a large slice of the risk on every trade.
Verdict
Fail. The Opening Price Principle is mostly a property of random paths dressed up as a market secret. As a way to set stops or targets for intraday trades on UK shares, it doesn’t help: a stop at the open is just a tight stop that gets hit often and pays costs every time. It agrees with Gecko’s earlier opening range breakout work: around the open on UK shares, edges are thin and costs decide the outcome.