 GECKO
GECKO
Update, 30 September 2026 - Stamp Duty (STT in Sth Africa). A day after this was written, real paper-account fills showed IBKR charging UK Stamp Duty on every share purchase, which gecko’s backtests had never modelled. The VWAP finding below still stands - it genuinely improves the strategy - but once Stamp Duty is charged the strategy loses money as share trading. The figures below are before Stamp Duty; the Stamp Duty section has the full picture.
How we got here
This one started with a hunch from paper trading: I felt I was getting stopped out early. The data agreed. In the 8:1 backtest the tips were coming from, 46% of trades that hit their stop went on to reach the target within their 14-day window anyway - and more than half were stopped out on the very day they were entered. With the stop placed only an eighth of the way to the target, ordinary day-to-day wobble was enough to knock trades out.
Step 1: widen the stop
Same entries, same targets, stop moved further out - 8:1 down to 3:1, across 115 stocks:
| Stop | Win rate | Avg R | Net (10 years) |
|---|---|---|---|
| 8:1 | 15.8% | 0.35 | £7,820 |
| 6:1 | 19.1% | 0.27 | £8,736 |
| 5:1 | 21.6% | 0.22 | £8,784 |
| 4:1 | 25.2% | 0.19 | £10,958 |
| 3:1 | 30.8% | 0.16 | £14,439 |
The surprise: 8:1 has the best Average R but makes the least money. The reason is the account size. The backtest risks up to £100 a trade on a £5,000 account, but a position can’t cost more than the account. An 8:1 stop sits on average just 0.63% below entry - risking £100 would need a £16,000 position - so in practice those trades only put about £30 at risk. At 3:1 the stop is 1.69% away and trades carry about £70 of risk. Better per unit of risk, worse in pounds. On a small account, 3:1 wins.
Step 2: record everything about every trade
Separately, gecko started recording a snapshot of 15 factors for every trade, as they stood on the signal day - nothing from later. The long-term plan is a school-style A*-to-F grade for each tip; the first step is simply to capture the ingredients and see which ones actually line up with winning trades.
| # | Factor | What it records |
|---|---|---|
| 1 | Market-cap tier | Large, mid or small cap |
| 2 | Risk % | How far the stop is from the entry, as a % of the price |
| 3 | Target distance % | How far the target is from the entry |
| 4 | Target zone touches | How many times price has turned at the resistance zone used as the target |
| 5 | Day of week | Which day the signal fired |
| 6 | ADX | How strongly trending the stock was |
| 7-9 | Market trend (1 month, 3 months, 1 year) | Whether the whole LSE was moving with or against the trade |
| 10 | Price vs 50-day average | Above or below it, relative to the trade’s direction |
| 11 | Price vs 200-day average | The same, for the long-term trend |
| 12 | Position in 52-week range | 0 = at the year’s low, 1 = at the year’s high |
| 13 | Volume vs 20-day average | Was the signal day busier than usual? |
| 14 | Close within the day’s range | Did the day close near its high or its low? |
| 15 | Close vs VWAP | Did the day close on the trade’s side of its VWAP? |
Trend-type factors are stored as WITH / AGAINST the trade, so a short in a falling market counts the same as a long in a rising one.
One factor leapt out. On the 3:1 trades, the 2,336 whose signal day closed on the trade’s side of VWAP averaged 0.21R and made £19,516; the other 649 averaged −0.02R and lost £5,077 - and, crucially, those “wrong side” trades lost money in 8 of the 11 years. That’s not one lucky year doing the work.
Why the VWAP filter works, in plain terms
VWAP is the average price everyone actually paid for the stock that day, weighted by how many shares changed hands. So where the day closes relative to VWAP tells you who ended the day happy:
- Closed above VWAP (for a long): most of the day’s buyers are already in profit. Nobody is desperate to get out, and the buyers were still in control at the end of the day. When TFM places its buy order just above that day’s high, there’s a decent chance the push carries on through it.
- Closed below VWAP: the day faded. Most of the shares bought that day are showing a loss at the close. Those buyers tend to sell as soon as the price climbs back to where they got in - so any bounce runs into a wall of sellers. TFM’s entry above the day’s high can still trigger, but it’s much more likely to be a brief poke that falls straight back and takes out the stop.
In other words, the three TFM indicators say “the trend has turned in our favour”, and VWAP adds “…and today’s actual trading backs that up.” A signal day that closed on the wrong side of VWAP is a signal the market didn’t believe by the close.
Here are two real TFM long signals from 29 September 2026 - both passed EMA, MACD and Stochastic; only one survives the new check:
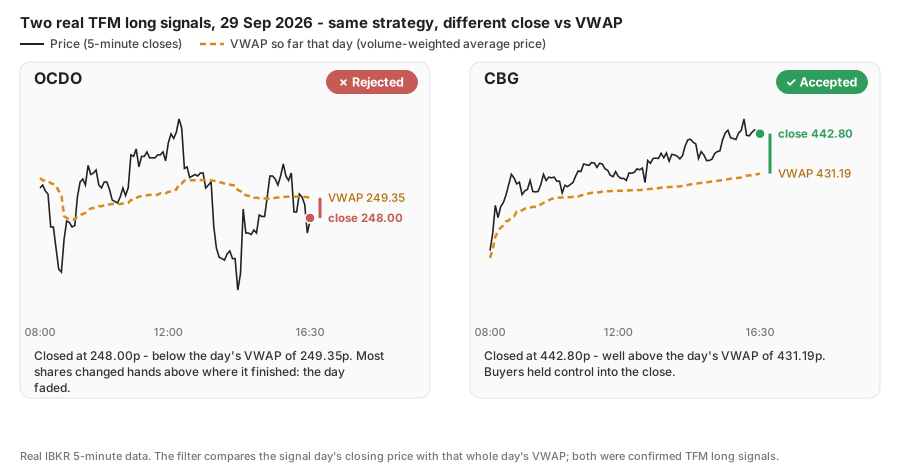
OCDO spent the afternoon slumping, bounced, but still finished below where most of its volume traded. Before the filter it would have become a tip (it did - I placed it); with the filter it doesn’t. CBG climbed all day and closed far above its VWAP - exactly the kind of day the filter wants. (Whether OCDO’s trade actually loses is still playing out - one example illustrates the rule, it doesn’t prove it. The ten years below do the proving.)
And this is where the check now sits in each evening’s scan:
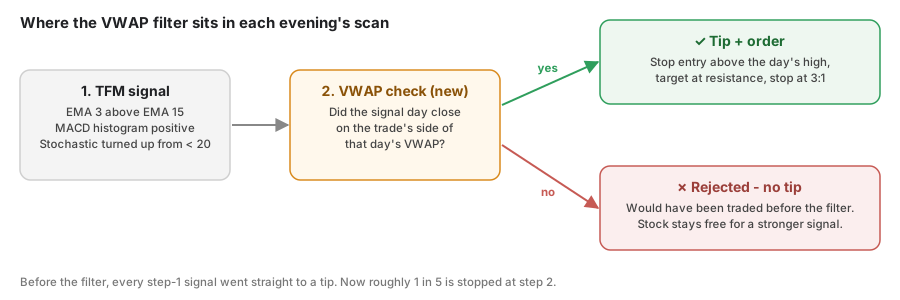
A rejected signal also frees the stock up. Gecko only allows one position per stock at a time, so a weak signal that would have occupied a stock for 14 days no longer blocks a stronger one a few days later.
The result
The filter was built as a real strategy setting and the full backtest re-run - not just the losing trades deleted from the old results:
| 3:1, 115 stocks, 2016-2026 | Without filter | With VWAP filter |
|---|---|---|
| Trades | 2,985 | 2,789 |
| Win rate | 30.8% | 32.1% |
| Average R | 0.16 | 0.21 |
| Profit factor | 1.23 | 1.30 |
| Net result | £14,439 | £22,251 (+54%) |
| Worst peak-to-trough drop | £5,554 | £3,258 |
| Commission | £17,910 | £16,734 |
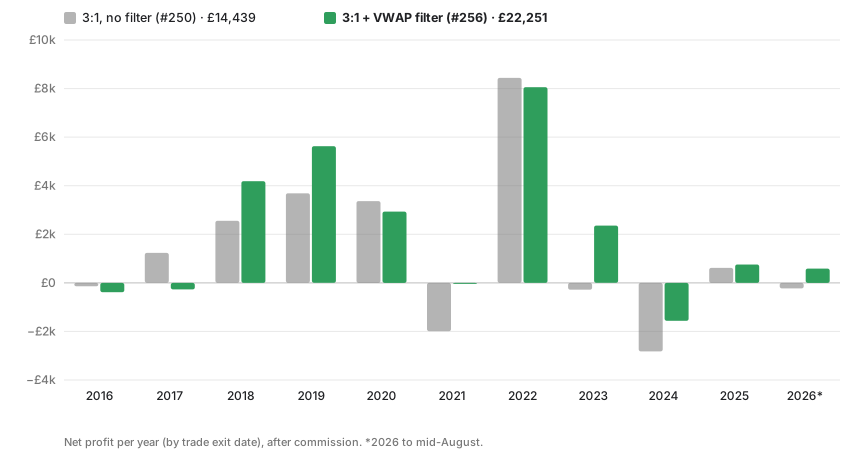
It’s better in 7 of 11 years, and it helps most exactly where it’s needed: the two worst years shrink (2021 goes from −£1,988 to roughly break-even, 2024 from −£2,820 to −£1,561) and 2023 turns from a small loss into +£2,357. It costs a little in 2016-17 and 2020.
For comparison, the previous best TFM configuration on this site (“stacked improvements”) made £16,845 on the 110-stock basket.
The permutation test
| Without filter | With VWAP filter | |
|---|---|---|
| Real average R | 0.163 | 0.209 |
| Shuffled range | −0.094 to 0.095 | −0.069 to 0.128 |
| Beats | 1,000 / 1,000 shuffles | 1,000 / 1,000 shuffles |
The filtered strategy’s real result sits far outside anything the 1,000 random direction-shuffles produced.
The catch: UK Stamp Duty
Every figure above is before Stamp Duty - and that turns out to matter more than anything else in this post.
When you buy shares in a UK-registered company you pay Stamp Duty Reserve Tax: 0.5% of the value of what you buy (1% for Irish-registered companies; nothing for AIM shares or companies registered abroad). It’s charged on a long trade’s purchase and on a short trade’s buy-back. Gecko’s backtests had only ever charged a flat £3 commission per order. The paper account showed the truth the day after the post above: buying 779 PayPoint shares at 644p cost £3 commission plus £25.08 Stamp Duty. Buying Wizz Air shares - a Jersey company - cost just £3.
Re-running exactly the same backtest with Stamp Duty charged on every purchase:
| 3:1 + VWAP filter, 115 stocks | Before Stamp Duty (#256) | With Stamp Duty (#257) |
|---|---|---|
| Trades | 2,789 | 2,789 |
| Gross profit (winning trades) | £170,147 | £154,791 |
| Gross loss (losing trades) | £131,162 | £119,257 |
| Commission | £16,734 | £16,734 |
| Stamp Duty | - | £58,106 |
| Net result | £22,251 | −£39,306 |
(Gross figures shrink a little in #257 because position sizing now counts the duty inside each trade’s £100 risk budget, so positions are slightly smaller.)
How can a 0.5% charge wipe out everything? Because it’s charged on the size of the position, not on the profit. Per trade, on average:
| Per trade | £ | % of the £4,369 position |
|---|---|---|
| Gross profit (winners minus losers) | +£12.74 | +0.29% |
| Commission | −£6.00 | −0.14% |
| Stamp Duty | −£20.83 | −0.48% |
| Net | −£14.09 | −0.32% |
The strategy makes under 0.3% on each position it opens; the duty takes 0.5% of it. A buy-and-hold investor pays the 0.5% once against years of gains - a strategy trading about 280 times a year pays it 280 times against small ones.
What this does and doesn’t mean. Average R is unchanged at 0.21 and the permutation test still passes: the signals are as good as before, and the VWAP filter still makes them better. What fails is paying 0.5% duty on every trade. Routes worth testing next:
- CFDs (contracts for difference) on the same shares follow the same prices, but carry no Stamp Duty - instead there’s a small percentage commission and an overnight financing charge while a trade is open. Done: see Shares vs CFDs - as CFDs the strategy makes £17,966.
- Fewer, better trades - using the grading factors to keep only the strongest signals, so the fixed costs are spread over bigger average wins.
- Duty-free stocks (AIM-quoted or non-UK registered) - only 6 of the current 115, so a wider search would be needed.
What changed in gecko
- It’s now the strategy behind the tips - still paper-traded only. The nightly tips come from this backtest (#256), replacing the 8:1 one. Stamp Duty is now counted in backtests and in tip position sizing.
- Tips need 5-minute candles for the signal day, but the weekday job only fetches daily ones. So the scanner now does a quick first pass, finds which stocks are confirming, and fetches today’s 5-minute data for just those few before applying the filter. If the data can’t be fetched, the signal is rejected rather than tipped unchecked.
- Fewer tips per night - roughly one in five signals is now filtered out.
What’s still worth checking
- As share trading it doesn’t pay. See the Stamp Duty section: with duty charged the ten years lose £39,306. Even before duty, commission (£16.7k) was close to the whole net profit.
- It’s still lumpy. Even with the filter, 2016, 2017, 2021 and 2024 lose money, and 2022 alone contributes over a third of the total.
- VWAP was spotted in the same ten years it was then tested on. The year-by-year consistency and the permutation test make a fluke unlikely, but the real test is the forward test: live paper trades from here on, compared trade by trade with what the backtest says should have happened.
- Worth knowing: these backtests actually start evaluating on 31 August 2016, not 1 June - gecko wants a full year of history first, and its daily candles began in September 2015. Since fixed: daily candles now go back to May 2015, so later runs (from the CFD comparison on) start on 1 June 2016.