 GECKO
GECKOWhy this needed re-checking from scratch
Every number in this post replaces an earlier version of itself. Across one session, four separate, real bugs were found in the exact same TFM pipeline, each one capable of making a result look better than it actually was:
- Overlapping/duplicate trades - the same instrument+direction could get independently confirmed on several consecutive days, spawning multiple overlapping trades instead of one. Fixed with a dedup filter.
- Blind pending orders - once a trade was confirmed, nothing re-checked whether EMA/MACD/Stochastic were still true while the order sat waiting to fill, sometimes for days. Fixed with daily re-validation that cancels the order the moment the setup reverses.
- Leveraged position sizing - a very tight stop (the arithmetic result of a high reward:risk ratio) could inflate share count to unrealistic levels - confirmed at one point averaging £18,969 in position value on a £5,000 account. Fixed with a hard cap at 100% of starting capital.
- A permutation-test reconstruction artifact - the statistical validation itself was silently broken for TFM specifically. Direction-shuffled trades were reusing the real trade’s own entry price instead of the true opposite-direction price, making every null-distribution shuffle look artificially strong. This is worth dwelling on because of what it did to the result: before the fix, TFM’s real, correctly-directional trades appeared to lose to 100% of random shuffles - the opposite of what a real edge should look like. After persisting the correct opposite-direction price, the same real result beat 100% of shuffles instead. Same underlying trades, same code, opposite statistical conclusion - purely from fixing how the null hypothesis was being tested.
With all four fixed, the reward:risk sweep first run in the exit-tuning series and the TFM-overtakes-ORB finding was re-run against Gecko’s current, wider 110-stock backtest_core basket (2016-06-01 to 2026-08-15) - both of those earlier posts’ numbers predate this entire fix chain and shouldn’t be compared directly against what follows.
The headline figures
| Reward:Risk | Net profit | Profit factor | Average R | Win rate | Winning trades |
|---|---|---|---|---|---|
| 1.5 | £4,578 | 1.18 | 0.10 | 43.4% | 1,242 |
| 2.0 (baseline) | £5,532 | 1.17 | 0.11 | 37.9% | 1,084 |
| 2.5 | £10,735 | 1.21 | 0.14 | 33.9% | 970 |
| 3.0 | £12,018 | 1.23 | 0.16 | 30.3% | 867 |
| 4.0 | £10,496 | 1.25 | 0.19 | 25.0% | 714 |
| 5.0 | £8,072 | 1.26 | 0.22 | 21.4% | 613 |
| 6.0 | £7,689 | 1.29 | 0.27 | 19.0% | 543 |
| 8.0 | £7,231 | 1.36 | 0.36 | 15.7% | 450 |
Every single point on this ladder beats 100% of 1,000 random direction-shuffles (detail below) - so this isn’t a case of picking the best-looking point out of a mix of real and noise results. All eleven configurations tested (the table above plus 2.75/3.25/3.5, omitted for brevity) hold up individually. The question is which one is actually the best trading result, not just the best statistic.
Profit factor and average R climb monotonically all the way to RR 8.0 - mechanically, because the take-profit target is a fixed support/resistance level while the stop is arithmetically backed out as target distance ÷ reward:risk, so a higher ratio means a tighter stop and a bigger relative payout on the trades that still win. Total net profit does not follow the same curve - it peaks around RR 3.0 and falls away on both sides, because each further increase in the ratio keeps improving the quality of the trades that remain, by discarding an increasing share of the winning trades outright (867 down to 450, a 48% drop from RR 3.0 to RR 8.0). Past a point, that volume loss outweighs the per-trade improvement.
The permutation test
Each configuration’s real, unshuffled average R was checked against 1,000 direction-shuffles of its own trade set (same setups, LONG/SHORT randomly reassigned, reward:risk profile preserved) - the standard test on this site for whether a result is a genuine directional signal or something chance could produce just as easily.
| RR 3.0 | RR 8.0 | |
|---|---|---|
| Real average R | 0.1613 | 0.3574 |
| Null distribution mean | -0.0165 | 0.1187 |
| Null distribution range | -0.090 to 0.061 | -0.031 to 0.258 |
| Real result beats | 1,000 / 1,000 shuffles | 1,000 / 1,000 shuffles |
| Percentile | 100.0th | 100.0th |
Both are about as clean a permutation-test result as this site has produced - the real result doesn’t just edge out the null distribution, it clears its entire range. Worth noting the null distribution’s own mean rises with the reward:risk ratio too (a wider ratio raises variance for random shuffles as well as real trades) - the real result stays comfortably ahead of it either way.
What actually separates a win from a loss
Looking at individual trades in the RR 8.0 run makes the mechanism obvious in a way the summary statistics don’t:
| Count | Average net | Range | |
|---|---|---|---|
| Losses | 2,412 | −£34.01 | −£6 to −£100 |
| Wins | 450 | +£198.37 | +£26 to +£723.95 |
An average winner is worth about 5.8 average losers - close to the nominal 8:1 target once the fixed £6 round-trip commission is accounted for, which eats proportionally more into a small, tight-stop loss than into a large win. The whole result is 450 × £198 against 2,412 × £34, netting to the £7,231 reported above. It’s worth checking this isn’t a couple of lucky outliers doing all the work: the ten largest winning trades total £5,391, just 6% of all win profit - the edge is broadly spread across the 450 winners, not dependent on a handful of exceptional ones.
Here’s one of those winners - IMB (Imperial Brands), a LONG confirmed 4th November 2025, entered on a buy-stop above the confirmation day’s high, and exiting on target eight days later:
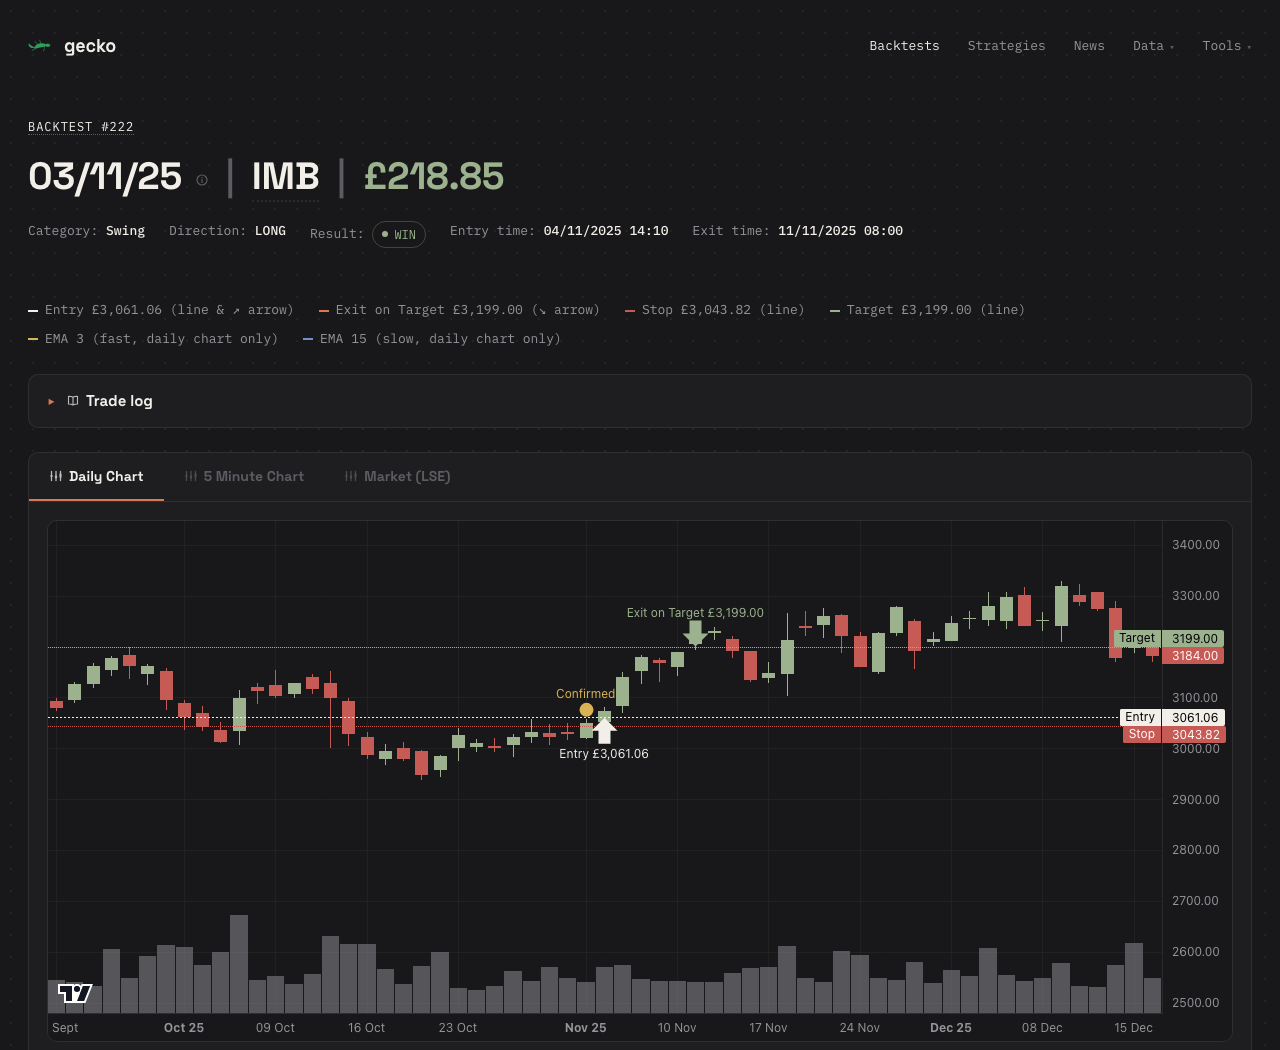
Note how tight the stop sits relative to entry compared to the target above it - that gap is what an 8:1 reward:risk ratio actually looks like on a chart, and it’s the same shape (just proportionally less extreme) behind every point on the ladder above.
Entry and exit criteria
Every configuration in this ladder shares the same entry logic and differs only in the reward:risk ratio driving the exit. In full:
Entry - TFM’s three same-instrument conditions, all of which must hold simultaneously (see how Gecko was born for the wider strategy family this sits alongside):
- EMA3 above EMA15 for a LONG (below, for a SHORT) - the short-period Exponential Moving Average sitting on the correct side of the longer one, TFM’s simplest condition, a same-day state rather than an event.
- MACD histogram positive for a LONG (negative, for a SHORT) - the gap between an 8-period and 17-period EMA, smoothed again into a signal line.
- Stochastic crossed and hasn’t reversed since - not simply “is it below 20” (a state that stays true through most of a downtrend), but that it crossed up from below 20 (or down from above 80) at some point and hasn’t reversed since, found by scanning back through the available candle history rather than reading a single day’s value.
Two additional entry-stage safeguards, on for every run in this series:
- Duplicate-entry de-duplication - once a trade is confirmed for an instrument+direction, no new trade is raised for that same instrument+direction while the first one is still live or pending.
- Daily re-validation - while an order is pending, all three conditions above are re-checked once per trading day; the moment any of them flips, the order is cancelled outright rather than left waiting on price alone.
Exit, the one thing that varies across the ladder:
- Entry order: a buy-stop (LONG) or sell-stop (SHORT) placed just beyond the confirmation day’s high/low, with a small buffer.
- Target: the nearest support/resistance zone in the direction of the trade, built from swing highs/lows over a trailing 365-day window (at least 2 touches, minimum 6 bars apart, to count as a real level).
- Stop: arithmetically derived from the target distance and the reward:risk ratio being tested (
stop distance = target distance ÷ reward:risk) - this is the one parameter that changes between every row in the headline table. - Expiry: 14 trading days for the entry order to fill and, separately, for the resulting position to resolve, after which it’s forced closed as a timeout.
- Position sizing: 2% of account risked per trade by default, capped at 100% of starting capital (no leverage) if a very tight stop would otherwise imply a larger position.
What’s still unproven
Three real caveats, in order of how much they matter:
Selection bias across the sweep. Eleven reward:risk configurations were tested against the same dataset, and each one individually passed its own permutation test - but that test only asks “is this specific result different from random,” not “did trying eleven variants and reporting the best one inflate how good it looks.” That’s a genuine, unresolved risk with this kind of sweep, even a principled, pre-specified one like this - it would take testing on data none of the eleven configurations ever touched to rule out.
No out-of-sample validation yet. Every number above comes from the same 2016-2026 window the reward:risk ratio itself was chosen from. A held-out period never used in any tuning decision - ideally genuinely new data collected after this point - is the real test of whether this survives contact with the future rather than just this past.
Backtest execution is optimistic versus real trading. Stop orders fill instantly at the exact price a candle touches in this model; real markets have spread, can gap through a stop, and (for a daily-sweep scanner rather than a real-time system) some lag between signal and action. None of this invalidates the statistical result, but it’s a reason the real, tradeable edge is probably somewhat smaller than the backtest number.
Which one to actually use
RR 8.0 has the best per-trade statistics of anything tested here, but a 15.7% win rate is a genuine behavioural hazard in real trading, independent of whether the underlying maths is sound - long streaks of small losses are exactly the condition under which a system gets abandoned before it’s had time to prove itself. RR 3.0’s 30.3% win rate and higher total profit make it the more sensible starting point for tentative, low-stakes real trading, with RR 8.0 kept as the reference for “what the edge looks like at its most concentrated.” Neither is going live before the caveats above are addressed - this post is the validation step, not the go-ahead.