 GECKO
GECKO
TL;DR
- The idea: a day when a stock trades far more shares than usual and closes decisively higher has usually absorbed real news - results, a deal, an upgrade. The bet is that the price keeps drifting the same way for weeks while the market digests it.
- The rules: volume at least 5x its 50-day average and a close at least 3% up; buy with a market order at the next open; stop 2.5 x ATR below; sell after 20 trading days.
- The result: +0.18R a trade after costs, +£10,134 over ten years on a £10,000 account, 9 of 11 years positive - and it beats all 1,000 random-entry shuffles. The volume spike genuinely predicts the drift.
- The catch: it’s modest and bumpy. The Sharpe ratio is 0.48 against our 0.5 bar, the worst peak-to-trough fall was a third of the account, and at a £5,000 account the £3 minimum CFD commission eats a lot of it.
- Next: paper trading, at normal risk, with tips generated every evening.
What an EVS trade looks like
A real trade from the best run (#289): Vodafone, July 2026. After weeks of drifting down, Vodafone traded 235 million shares in a day - 5.5x its 50-day average - and closed 12.6% higher. That’s the signal. The trade bought at the next morning’s open, set its stop 2.5 x ATR below, and simply held for 20 trading days. The price ran up, dipped back towards the entry, then recovered - and the trade closed at +1.66R.
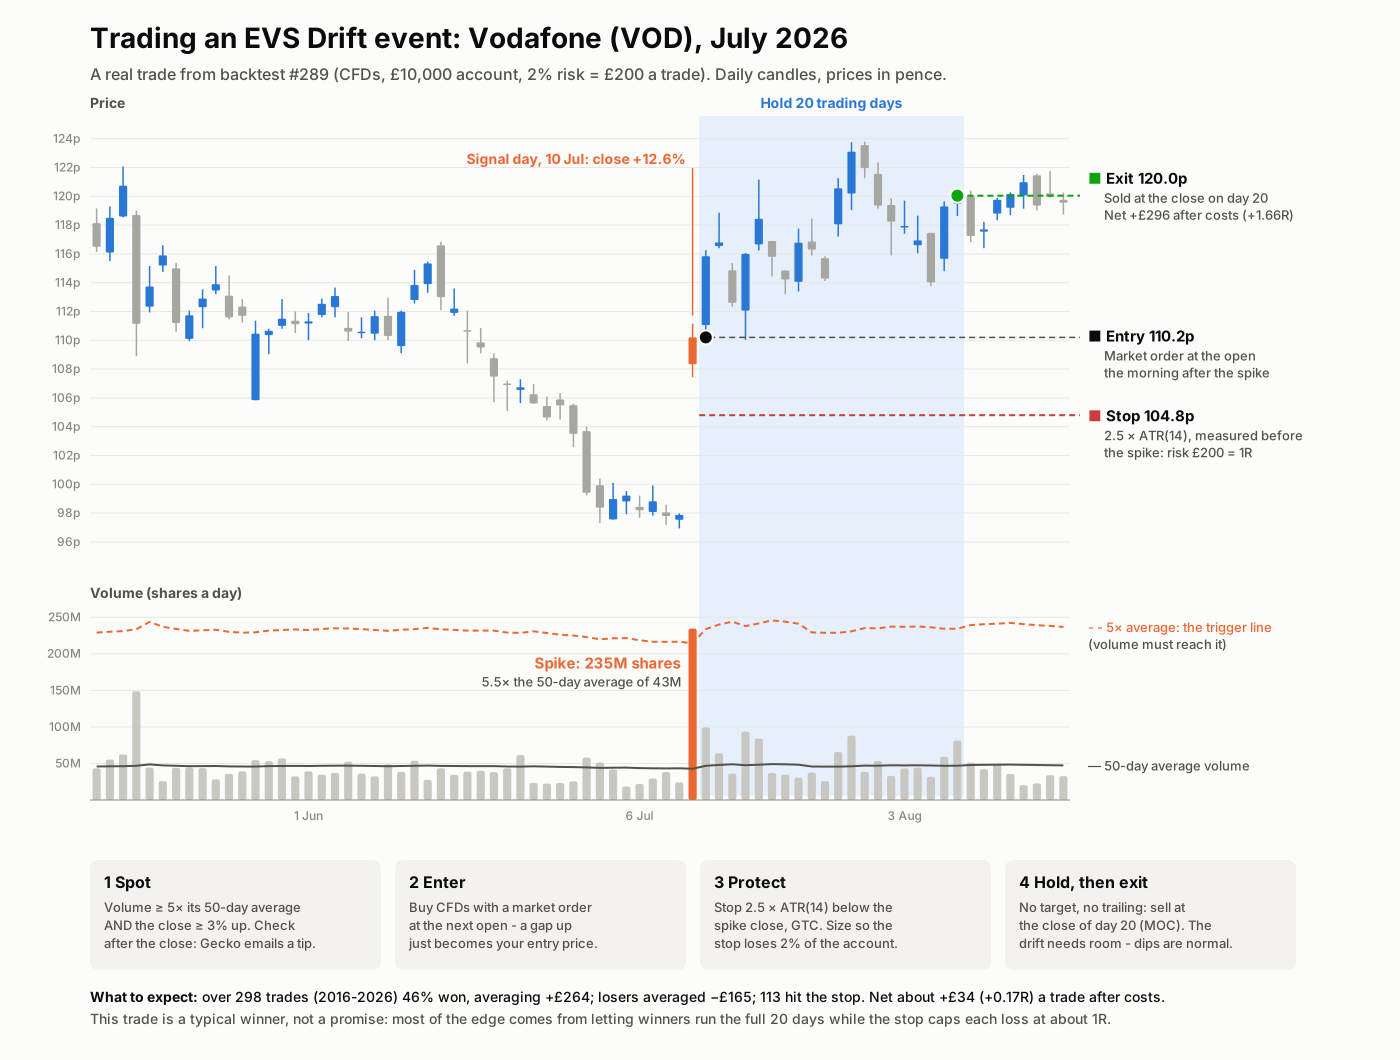
It’s a typical winner, not a promise: fewer than half of EVS trades win. The edge comes from winners like this one running for the full 20 days while the stop caps each loser at about 1R.
Built from TFM’s failure
The forward test found TFM’s flaw: its buy-stops sat right where morning gaps land, and its stops were so tight that a normal gap ate the whole trade’s risk. So EVS was designed around three rules from day one:
- Enter at the open, on purpose. A market order at the next open makes any overnight gap the entry price, not slippage.
- Wide stops. 2.5 x the stock’s average daily range (about 8% away) - an ordinary gap barely dents it.
- Fewer, longer trades. A few a month, held for weeks, so commission is a small part of each.
And it’s built on volume, not the price indicators TFM used - a genuinely different signal.
The baseline, and a bug in my own spec
The first run (4x spike, 3% move, longs) made +0.135R a trade before costs - the first honest positive edge since the fill flaw - but only +0.044R after. Its stops averaged 10% away rather than the 5-8% intended: the spike day’s own huge range was going into the ATR. Measuring the ATR over the 14 days before the spike fixed that, lifting net profit by two-thirds.
The series - one change at a time
| Run | Change | Trades | Avg R after costs | Sharpe | Positive years |
|---|---|---|---|---|---|
| #282 | baseline (4x spike, 20 days, £5k) | 544 | +0.074 | 0.23 | 7/11 |
| #280 | shorts on down-spikes | 637 | −0.038 | −0.24 | - |
| #285 | 5x spike | 298 | +0.144 | 0.36 | 9/11 |
| #289 | 5x spike, £10k account | 298 | +0.177 | 0.48 | 9/11 |
| #295 | 4x + trend & calm filters (£10k) | 263 | +0.154 | 0.36 | 10/11 |
| #299 | breakeven stop at +1R | 298 | +0.126 | 0.32 | 8/11 |
| #304 | 40-day hold | 287 | +0.189 | 0.38 | 7/11 |
What each test taught:
- Shorts don’t work. After a big down spike, stocks dip a little and then bounce back above normal. EVS is long-only.
- Bigger spikes drift further. 5x beats 4x on quality, at the cost of fewer trades.
- Regime filters smooth the ride but don’t strengthen the edge. News drift works in downtrends too.
- Profit protection hurts. Trailing stops, breakeven stops and delayed trails all give back more than they save: winners often dip back to their entry before drifting up. The edge is in letting the full 20 days play out.
- Longer holds don’t pay. 30 and 40 days mostly give the stop more chances to be hit, and tie money up twice as long.
Is it real? The random-entry test
A long-only strategy in a decade when UK stocks mostly rose could look good just by being invested. So the test: take the same number of trades in the same stocks on random days, with the same stop and 20-day hold, 1,000 times over.
Random days made +0.04R a trade - the decade’s general rise. EVS days made +0.25R, beating all 1,000 random shuffles. The timing is the edge, not the market.
The account-size effect
The £3 minimum CFD commission is fixed, so on a £5,000 account (positions of about £1,300) it takes a big bite. On £10,000 at the same 2% risk, positions double and costs halve relative to each trade: the same trades go from +0.14R to +0.18R. Raising the risk to 4% on £5,000 gives the same £ result - but a worst fall of two-thirds of the account, which isn’t a risk worth taking.
Verdict
Caution - promising. EVS is the first strategy with an edge that survives realistic fills, real CFD costs and a significance test. But it’s modest: a Sharpe just under 0.5, and a drawdown of a third of the account at its worst. It now runs as a nightly tip scan and goes to paper trading - the forward test is what caught TFM’s flaw, and it gets the final word here too.